Peruvian vs Immigrants from Cuba Bachelor's Degree

COMPARE

Peruvian
Race
Ancestry
AfghanAfricanAlaska NativeAlaskan AthabascanAlbanianAleutAlsatianAmericanApacheArabArapahoArgentineanArmenianAssyrian/Chaldean/SyriacAustralianAustrianBahamianBangladeshiBarbadianBasqueBelgianBelizeanBermudanBhutaneseBlackfeetBolivianBrazilianBritishBritish West IndianBulgarianBurmeseCajunCambodianCanadianCape VerdeanCarpatho RusynCelticCentral AmericanCentral American IndianCherokeeCheyenneChickasawChileanChineseChippewaChoctawColombianColvilleComancheCosta RicanCreeCreekCroatianCrowCubanCypriotCzechCzechoslovakianDanishDelawareDominicanDutchDutch West IndianEastern EuropeanEcuadorianEgyptianEnglishEstonianEthiopianEuropeanFijianFilipinoFinnishFrenchFrench American IndianFrench CanadianGermanGerman RussianGhanaianGreekGuamanian/ChamorroGuatemalanGuyaneseHaitianHmongHonduranHopiHoumaHungarianIcelanderIndian (Asian)IndonesianInupiatIranianIraqiIrishIroquoisIsraeliItalianJamaicanJapaneseJordanianKenyanKiowaKoreanLaotianLatvianLebaneseLiberianLithuanianLumbeeLuxembourgerMacedonianMalaysianMalteseMarshalleseMenomineeMexicanMexican American IndianMongolianMoroccanNative HawaiianNavajoNepaleseNew ZealanderNicaraguanNigerianNorthern EuropeanNorwegianOkinawanOsageOttawaPaiutePakistaniPalestinianPanamanianParaguayanPennsylvania GermanPeruvianPimaPolishPortuguesePotawatomiPuebloPuerto RicanPuget Sound SalishRomanianRussianSalvadoranSamoanScandinavianScotch-IrishScottishSeminoleSenegaleseSerbianShoshoneSierra LeoneanSiouxSlavicSlovakSloveneSomaliSouth AfricanSouth AmericanSouth American IndianSoviet UnionSpaniardSpanishSpanish AmericanSpanish American IndianSri LankanSubsaharan AfricanSudaneseSwedishSwissSyrianTaiwaneseThaiTlingit-HaidaTohono O'OdhamTonganTrinidadian and TobagonianTsimshianTurkishU.S. Virgin IslanderUgandanUkrainianUruguayanUteVenezuelanVietnameseWelshWest IndianYakamaYaquiYugoslavianYumanYup'ikZimbabwean
Immigration
NonimmigrantsImmigrantsAfghanistanAfricaAlbaniaArgentinaArmeniaAsiaAustraliaAustriaBahamasBangladeshBarbadosBelarusBelgiumBelizeBoliviaBosnia and HerzegovinaBrazilBulgariaBurma/MyanmarCabo VerdeCambodiaCameroonCanadaCaribbeanCentral AmericaChileChinaColombiaCongoCosta RicaCroatiaCzechoslovakiaDenmarkDominicaDominican RepublicEastern AfricaEastern AsiaEastern EuropeEcuadorEgyptEl SalvadorEnglandEritreaEthiopiaEuropeFijiFranceGermanyGhanaGreeceGrenadaGuatemalaGuyanaHaitiHondurasHong KongHungaryIndiaIndonesiaIranIraqIrelandIsraelItalyJamaicaJapanJordanKazakhstanKenyaKoreaKuwaitLaosLatin AmericaLatviaLebanonLiberiaLithuaniaMalaysiaMexicoMicronesiaMiddle AfricaMoldovaMoroccoNepalNetherlandsNicaraguaNigeriaNorth AmericaNorth MacedoniaNorthern AfricaNorthern EuropeNorwayOceaniaPakistanPanamaPeruPhilippinesPolandPortugalRomaniaRussiaSaudi ArabiaScotlandSenegalSerbiaSierra LeoneSingaporeSomaliaSouth AfricaSouth AmericaSouth Central AsiaSouth Eastern AsiaSouthern EuropeSpainSri LankaSt. Vincent and the GrenadinesSudanSwedenSwitzerlandSyriaTaiwanThailandTrinidad and TobagoTurkeyUgandaUkraineUruguayUzbekistanVenezuelaVietnamWest IndiesWestern AfricaWestern AsiaWestern EuropeYemenZaireZimbabweAzores
Immigrants from Cuba
Race
Ancestry
AfghanAfricanAlaska NativeAlaskan AthabascanAlbanianAleutAlsatianAmericanApacheArabArapahoArgentineanArmenianAssyrian/Chaldean/SyriacAustralianAustrianBahamianBangladeshiBarbadianBasqueBelgianBelizeanBermudanBhutaneseBlackfeetBolivianBrazilianBritishBritish West IndianBulgarianBurmeseCajunCambodianCanadianCape VerdeanCarpatho RusynCelticCentral AmericanCentral American IndianCherokeeCheyenneChickasawChileanChineseChippewaChoctawColombianColvilleComancheCosta RicanCreeCreekCroatianCrowCubanCypriotCzechCzechoslovakianDanishDelawareDominicanDutchDutch West IndianEastern EuropeanEcuadorianEgyptianEnglishEstonianEthiopianEuropeanFijianFilipinoFinnishFrenchFrench American IndianFrench CanadianGermanGerman RussianGhanaianGreekGuamanian/ChamorroGuatemalanGuyaneseHaitianHmongHonduranHopiHoumaHungarianIcelanderIndian (Asian)IndonesianInupiatIranianIraqiIrishIroquoisIsraeliItalianJamaicanJapaneseJordanianKenyanKiowaKoreanLaotianLatvianLebaneseLiberianLithuanianLumbeeLuxembourgerMacedonianMalaysianMalteseMarshalleseMenomineeMexicanMexican American IndianMongolianMoroccanNative HawaiianNavajoNepaleseNew ZealanderNicaraguanNigerianNorthern EuropeanNorwegianOkinawanOsageOttawaPaiutePakistaniPalestinianPanamanianParaguayanPennsylvania GermanPimaPolishPortuguesePotawatomiPuebloPuerto RicanPuget Sound SalishRomanianRussianSalvadoranSamoanScandinavianScotch-IrishScottishSeminoleSenegaleseSerbianShoshoneSierra LeoneanSiouxSlavicSlovakSloveneSomaliSouth AfricanSouth AmericanSouth American IndianSoviet UnionSpaniardSpanishSpanish AmericanSpanish American IndianSri LankanSubsaharan AfricanSudaneseSwedishSwissSyrianTaiwaneseThaiTlingit-HaidaTohono O'OdhamTonganTrinidadian and TobagonianTsimshianTurkishU.S. Virgin IslanderUgandanUkrainianUruguayanUteVenezuelanVietnameseWelshWest IndianYakamaYaquiYugoslavianYumanYup'ikZimbabwean
Immigration
NonimmigrantsImmigrantsAfghanistanAfricaAlbaniaArgentinaArmeniaAsiaAustraliaAustriaBahamasBangladeshBarbadosBelarusBelgiumBelizeBoliviaBosnia and HerzegovinaBrazilBulgariaBurma/MyanmarCabo VerdeCambodiaCameroonCanadaCaribbeanCentral AmericaChileChinaColombiaCongoCosta RicaCroatiaCubaCzechoslovakiaDenmarkDominicaDominican RepublicEastern AfricaEastern AsiaEastern EuropeEcuadorEgyptEl SalvadorEnglandEritreaEthiopiaEuropeFijiFranceGermanyGhanaGreeceGrenadaGuatemalaGuyanaHaitiHondurasHong KongHungaryIndiaIndonesiaIranIraqIrelandIsraelItalyJamaicaJapanJordanKazakhstanKenyaKoreaKuwaitLaosLatin AmericaLatviaLebanonLiberiaLithuaniaMalaysiaMexicoMicronesiaMiddle AfricaMoldovaMoroccoNepalNetherlandsNicaraguaNigeriaNorth AmericaNorth MacedoniaNorthern AfricaNorthern EuropeNorwayOceaniaPakistanPanamaPeruPhilippinesPolandPortugalRomaniaRussiaSaudi ArabiaScotlandSenegalSerbiaSierra LeoneSingaporeSomaliaSouth AfricaSouth AmericaSouth Central AsiaSouth Eastern AsiaSouthern EuropeSpainSri LankaSt. Vincent and the GrenadinesSudanSwedenSwitzerlandSyriaTaiwanThailandTrinidad and TobagoTurkeyUgandaUkraineUruguayUzbekistanVenezuelaVietnamWest IndiesWestern AfricaWestern AsiaWestern EuropeYemenZaireZimbabweAzores
Bachelor's Degree
Income
Poverty
Unemployment
Labor Participation
Family Structure
Vehicle Availability
Education Level
Disability

Bachelor's Degree Comparison

Peruvians

Immigrants from Cuba

Good
Tragic
38.3%
BACHELOR'S DEGREE
63.4/ 100
METRIC RATING
163rd/ 347
METRIC RANK
30.3%
BACHELOR'S DEGREE
0.0/ 100
METRIC RATING
301st/ 347
METRIC RANK

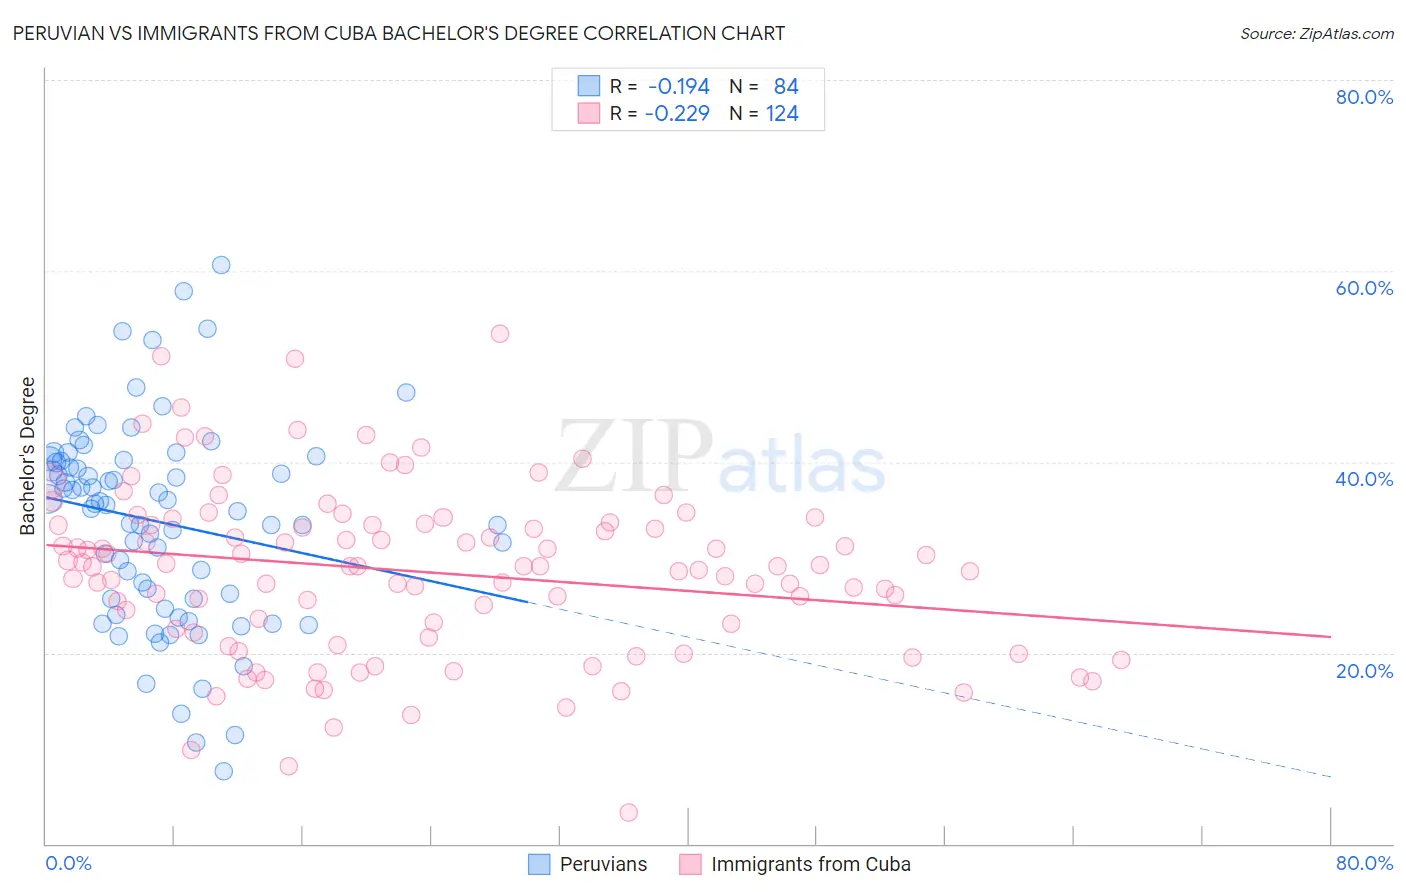
Peruvian vs Immigrants from Cuba Bachelor's Degree Correlation Chart

The statistical analysis conducted on geographies consisting of 363,225,668 people shows a poor negative correlation between the proportion of Peruvians and percentage of population with at least bachelor's degree education in the United States with a correlation coefficient (R) of -0.194 and weighted average of 38.3%. Similarly, the statistical analysis conducted on geographies consisting of 325,960,947 people shows a weak negative correlation between the proportion of Immigrants from Cuba and percentage of population with at least bachelor's degree education in the United States with a correlation coefficient (R) of -0.229 and weighted average of 30.3%, a difference of 26.4%.
Peruvian vs Immigrants from Cuba Bachelor's Degree

Bachelor's Degree Correlation Summary

MeasurementPeruvianImmigrants from Cuba
Minimum7.6%3.3%
Maximum60.7%53.5%
Range53.0%50.2%
Mean33.7%28.5%
Median35.6%29.1%
Interquartile 25% (IQ1)25.6%22.3%
Interquartile 75% (IQ3)40.1%33.4%
Interquartile Range (IQR)14.5%11.1%
Standard Deviation (Sample)10.5%8.9%
Standard Deviation (Population)10.5%8.9%

Similar Demographics by Bachelor's Degree

Demographics Similar to Peruvians by Bachelor's Degree

In terms of bachelor's degree, the demographic groups most similar to Peruvians are Hungarian (38.3%, a difference of 0.14%), Colombian (38.4%, a difference of 0.17%), Uruguayan (38.4%, a difference of 0.25%), Vietnamese (38.5%, a difference of 0.33%), and Chinese (38.5%, a difference of 0.34%).
DemographicsRating | RankBachelor's Degree
Kenyans
72.5
/100
|
#156
Good
38.7%
Immigrants | South America
70.1
/100
|
#157
Good
38.6%
Immigrants | Germany
69.6
/100
|
#158
Good
38.6%
Chinese
66.6
/100
|
#159
Good
38.5%
Vietnamese
66.6
/100
|
#160
Good
38.5%
Uruguayans
65.8
/100
|
#161
Good
38.4%
Colombians
65.0
/100
|
#162
Good
38.4%
Peruvians
63.4
/100
|
#163
Good
38.3%
Hungarians
62.1
/100
|
#164
Good
38.3%
Sri Lankans
59.1
/100
|
#165
Average
38.2%
Somalis
58.6
/100
|
#166
Average
38.1%
Scottish
56.6
/100
|
#167
Average
38.1%
Danes
56.2
/100
|
#168
Average
38.1%
Ghanaians
55.3
/100
|
#169
Average
38.0%
Czechs
54.4
/100
|
#170
Average
38.0%

Demographics Similar to Immigrants from Cuba by Bachelor's Degree

In terms of bachelor's degree, the demographic groups most similar to Immigrants from Cuba are Immigrants from Micronesia (30.4%, a difference of 0.22%), Chickasaw (30.4%, a difference of 0.23%), Mexican American Indian (30.2%, a difference of 0.28%), Bangladeshi (30.2%, a difference of 0.45%), and Cherokee (30.2%, a difference of 0.45%).
DemographicsRating | RankBachelor's Degree
Immigrants | Guatemala
0.0
/100
|
#294
Tragic
30.8%
Immigrants | Dominican Republic
0.0
/100
|
#295
Tragic
30.7%
Puget Sound Salish
0.0
/100
|
#296
Tragic
30.7%
Immigrants | Haiti
0.0
/100
|
#297
Tragic
30.6%
Chippewa
0.0
/100
|
#298
Tragic
30.6%
Chickasaw
0.0
/100
|
#299
Tragic
30.4%
Immigrants | Micronesia
0.0
/100
|
#300
Tragic
30.4%
Immigrants | Cuba
0.0
/100
|
#301
Tragic
30.3%
Mexican American Indians
0.0
/100
|
#302
Tragic
30.2%
Bangladeshis
0.0
/100
|
#303
Tragic
30.2%
Cherokee
0.0
/100
|
#304
Tragic
30.2%
Immigrants | Latin America
0.0
/100
|
#305
Tragic
30.1%
Immigrants | Yemen
0.0
/100
|
#306
Tragic
29.9%
Nepalese
0.0
/100
|
#307
Tragic
29.9%
Cajuns
0.0
/100
|
#308
Tragic
29.6%