Asian vs German Russian Master's Degree
COMPARE
Asian
German Russian
Master's Degree
Master's Degree Comparison
Asians
German Russians
18.4%
MASTER'S DEGREE
99.9/ 100
METRIC RATING
56th/ 347
METRIC RANK
13.5%
MASTER'S DEGREE
4.5/ 100
METRIC RATING
235th/ 347
METRIC RANK
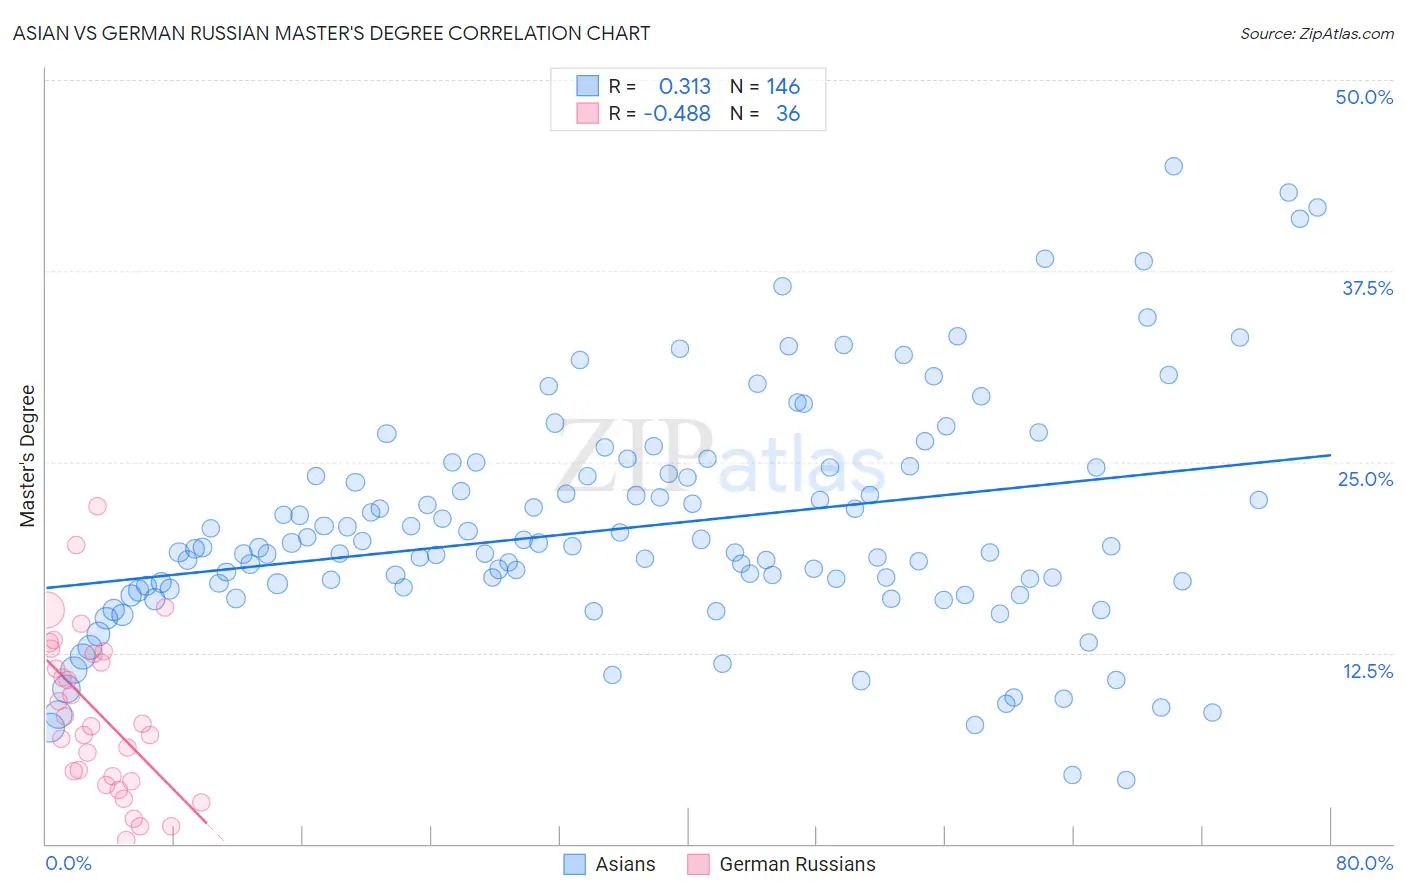
Asian vs German Russian Master's Degree Correlation Chart
The statistical analysis conducted on geographies consisting of 550,412,618 people shows a mild positive correlation between the proportion of Asians and percentage of population with at least master's degree education in the United States with a correlation coefficient (R) of 0.313 and weighted average of 18.4%. Similarly, the statistical analysis conducted on geographies consisting of 96,446,864 people shows a moderate negative correlation between the proportion of German Russians and percentage of population with at least master's degree education in the United States with a correlation coefficient (R) of -0.488 and weighted average of 13.5%, a difference of 37.0%.
Master's Degree Correlation Summary
| Measurement | Asian | German Russian |
| Minimum | 4.2% | 0.22% |
| Maximum | 44.3% | 22.1% |
| Range | 40.2% | 21.9% |
| Mean | 20.7% | 8.5% |
| Median | 19.3% | 7.8% |
| Interquartile 25% (IQ1) | 16.8% | 4.3% |
| Interquartile 75% (IQ3) | 24.2% | 12.5% |
| Interquartile Range (IQR) | 7.4% | 8.3% |
| Standard Deviation (Sample) | 7.5% | 5.3% |
| Standard Deviation (Population) | 7.5% | 5.2% |
Similar Demographics by Master's Degree
Demographics Similar to Asians by Master's Degree
In terms of master's degree, the demographic groups most similar to Asians are Immigrants from Asia (18.4%, a difference of 0.14%), Immigrants from Serbia (18.5%, a difference of 0.22%), Immigrants from Lithuania (18.5%, a difference of 0.26%), Australian (18.4%, a difference of 0.27%), and Immigrants from Czechoslovakia (18.5%, a difference of 0.57%).
| Demographics | Rating | Rank | Master's Degree |
| Estonians | 100.0 /100 | #49 | Exceptional 18.8% |
| Bulgarians | 100.0 /100 | #50 | Exceptional 18.8% |
| Immigrants | South Africa | 100.0 /100 | #51 | Exceptional 18.8% |
| Immigrants | Kuwait | 100.0 /100 | #52 | Exceptional 18.6% |
| Immigrants | Czechoslovakia | 99.9 /100 | #53 | Exceptional 18.5% |
| Immigrants | Lithuania | 99.9 /100 | #54 | Exceptional 18.5% |
| Immigrants | Serbia | 99.9 /100 | #55 | Exceptional 18.5% |
| Asians | 99.9 /100 | #56 | Exceptional 18.4% |
| Immigrants | Asia | 99.9 /100 | #57 | Exceptional 18.4% |
| Australians | 99.9 /100 | #58 | Exceptional 18.4% |
| Immigrants | Bulgaria | 99.9 /100 | #59 | Exceptional 18.3% |
| New Zealanders | 99.9 /100 | #60 | Exceptional 18.3% |
| Immigrants | Europe | 99.9 /100 | #61 | Exceptional 18.2% |
| Argentineans | 99.9 /100 | #62 | Exceptional 18.2% |
| Immigrants | Netherlands | 99.9 /100 | #63 | Exceptional 18.1% |
Demographics Similar to German Russians by Master's Degree
In terms of master's degree, the demographic groups most similar to German Russians are Immigrants from Guyana (13.4%, a difference of 0.11%), Jamaican (13.4%, a difference of 0.34%), Immigrants from Burma/Myanmar (13.5%, a difference of 0.41%), Hmong (13.4%, a difference of 0.48%), and Immigrants from Ecuador (13.6%, a difference of 0.91%).
| Demographics | Rating | Rank | Master's Degree |
| Whites/Caucasians | 9.1 /100 | #228 | Tragic 13.8% |
| British West Indians | 8.8 /100 | #229 | Tragic 13.8% |
| Dutch | 8.7 /100 | #230 | Tragic 13.8% |
| Guyanese | 7.6 /100 | #231 | Tragic 13.7% |
| Immigrants | Philippines | 6.0 /100 | #232 | Tragic 13.6% |
| Immigrants | Ecuador | 5.7 /100 | #233 | Tragic 13.6% |
| Immigrants | Burma/Myanmar | 5.0 /100 | #234 | Tragic 13.5% |
| German Russians | 4.5 /100 | #235 | Tragic 13.5% |
| Immigrants | Guyana | 4.4 /100 | #236 | Tragic 13.4% |
| Jamaicans | 4.1 /100 | #237 | Tragic 13.4% |
| Hmong | 4.0 /100 | #238 | Tragic 13.4% |
| Immigrants | Nonimmigrants | 3.4 /100 | #239 | Tragic 13.3% |
| Guamanians/Chamorros | 2.2 /100 | #240 | Tragic 13.1% |
| U.S. Virgin Islanders | 2.1 /100 | #241 | Tragic 13.1% |
| Spanish Americans | 1.9 /100 | #242 | Tragic 13.0% |