Asian vs Immigrants from Moldova Master's Degree
COMPARE
Asian
Immigrants from Moldova
Master's Degree
Master's Degree Comparison
Asians
Immigrants from Moldova
18.4%
MASTER'S DEGREE
99.9/ 100
METRIC RATING
56th/ 347
METRIC RANK
16.6%
MASTER'S DEGREE
97.2/ 100
METRIC RATING
117th/ 347
METRIC RANK
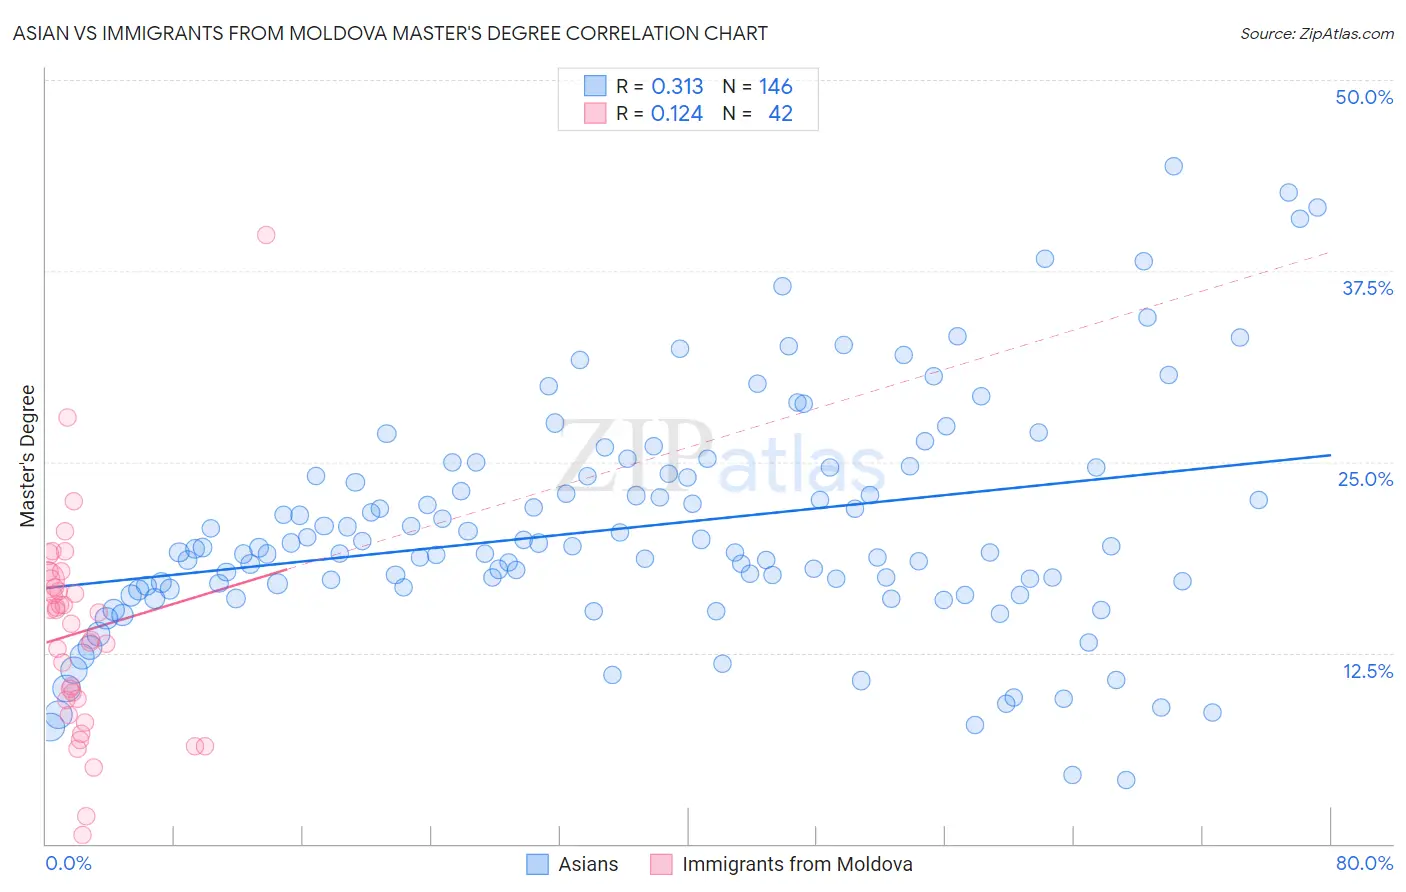
Asian vs Immigrants from Moldova Master's Degree Correlation Chart
The statistical analysis conducted on geographies consisting of 550,412,618 people shows a mild positive correlation between the proportion of Asians and percentage of population with at least master's degree education in the United States with a correlation coefficient (R) of 0.313 and weighted average of 18.4%. Similarly, the statistical analysis conducted on geographies consisting of 124,394,558 people shows a poor positive correlation between the proportion of Immigrants from Moldova and percentage of population with at least master's degree education in the United States with a correlation coefficient (R) of 0.124 and weighted average of 16.6%, a difference of 11.0%.
Master's Degree Correlation Summary
| Measurement | Asian | Immigrants from Moldova |
| Minimum | 4.2% | 0.61% |
| Maximum | 44.3% | 39.8% |
| Range | 40.2% | 39.2% |
| Mean | 20.7% | 13.8% |
| Median | 19.3% | 14.7% |
| Interquartile 25% (IQ1) | 16.8% | 9.4% |
| Interquartile 75% (IQ3) | 24.2% | 17.2% |
| Interquartile Range (IQR) | 7.4% | 7.9% |
| Standard Deviation (Sample) | 7.5% | 7.0% |
| Standard Deviation (Population) | 7.5% | 6.9% |
Similar Demographics by Master's Degree
Demographics Similar to Asians by Master's Degree
In terms of master's degree, the demographic groups most similar to Asians are Immigrants from Asia (18.4%, a difference of 0.14%), Immigrants from Serbia (18.5%, a difference of 0.22%), Immigrants from Lithuania (18.5%, a difference of 0.26%), Australian (18.4%, a difference of 0.27%), and Immigrants from Czechoslovakia (18.5%, a difference of 0.57%).
| Demographics | Rating | Rank | Master's Degree |
| Estonians | 100.0 /100 | #49 | Exceptional 18.8% |
| Bulgarians | 100.0 /100 | #50 | Exceptional 18.8% |
| Immigrants | South Africa | 100.0 /100 | #51 | Exceptional 18.8% |
| Immigrants | Kuwait | 100.0 /100 | #52 | Exceptional 18.6% |
| Immigrants | Czechoslovakia | 99.9 /100 | #53 | Exceptional 18.5% |
| Immigrants | Lithuania | 99.9 /100 | #54 | Exceptional 18.5% |
| Immigrants | Serbia | 99.9 /100 | #55 | Exceptional 18.5% |
| Asians | 99.9 /100 | #56 | Exceptional 18.4% |
| Immigrants | Asia | 99.9 /100 | #57 | Exceptional 18.4% |
| Australians | 99.9 /100 | #58 | Exceptional 18.4% |
| Immigrants | Bulgaria | 99.9 /100 | #59 | Exceptional 18.3% |
| New Zealanders | 99.9 /100 | #60 | Exceptional 18.3% |
| Immigrants | Europe | 99.9 /100 | #61 | Exceptional 18.2% |
| Argentineans | 99.9 /100 | #62 | Exceptional 18.2% |
| Immigrants | Netherlands | 99.9 /100 | #63 | Exceptional 18.1% |
Demographics Similar to Immigrants from Moldova by Master's Degree
In terms of master's degree, the demographic groups most similar to Immigrants from Moldova are Immigrants from Southern Europe (16.6%, a difference of 0.010%), Immigrants from Uganda (16.6%, a difference of 0.13%), Brazilian (16.5%, a difference of 0.42%), Northern European (16.7%, a difference of 0.43%), and Arab (16.7%, a difference of 0.50%).
| Demographics | Rating | Rank | Master's Degree |
| Immigrants | Chile | 98.0 /100 | #110 | Exceptional 16.8% |
| Austrians | 97.8 /100 | #111 | Exceptional 16.7% |
| Macedonians | 97.7 /100 | #112 | Exceptional 16.7% |
| Arabs | 97.7 /100 | #113 | Exceptional 16.7% |
| Northern Europeans | 97.6 /100 | #114 | Exceptional 16.7% |
| Immigrants | Uganda | 97.3 /100 | #115 | Exceptional 16.6% |
| Immigrants | Southern Europe | 97.2 /100 | #116 | Exceptional 16.6% |
| Immigrants | Moldova | 97.2 /100 | #117 | Exceptional 16.6% |
| Brazilians | 96.8 /100 | #118 | Exceptional 16.5% |
| Jordanians | 96.5 /100 | #119 | Exceptional 16.5% |
| Lebanese | 96.4 /100 | #120 | Exceptional 16.5% |
| Afghans | 96.2 /100 | #121 | Exceptional 16.5% |
| British | 95.6 /100 | #122 | Exceptional 16.4% |
| Croatians | 95.6 /100 | #123 | Exceptional 16.4% |
| Immigrants | Eritrea | 95.5 /100 | #124 | Exceptional 16.4% |