Asian vs Slovak Master's Degree
COMPARE
Asian
Slovak
Master's Degree
Master's Degree Comparison
Asians
Slovaks
18.4%
MASTER'S DEGREE
99.9/ 100
METRIC RATING
56th/ 347
METRIC RANK
14.9%
MASTER'S DEGREE
50.0/ 100
METRIC RATING
174th/ 347
METRIC RANK
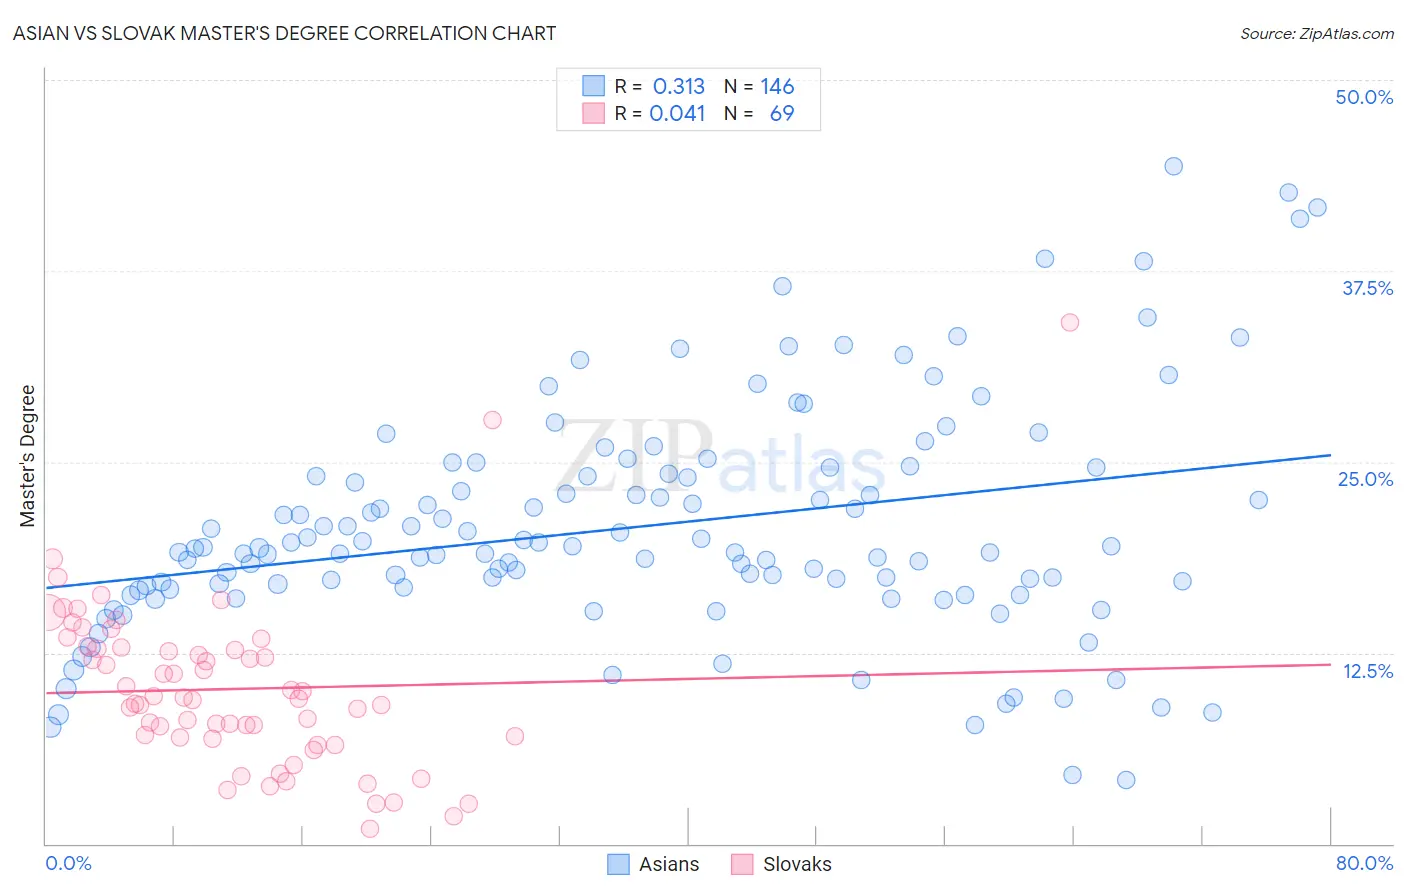
Asian vs Slovak Master's Degree Correlation Chart
The statistical analysis conducted on geographies consisting of 550,412,618 people shows a mild positive correlation between the proportion of Asians and percentage of population with at least master's degree education in the United States with a correlation coefficient (R) of 0.313 and weighted average of 18.4%. Similarly, the statistical analysis conducted on geographies consisting of 397,752,866 people shows no correlation between the proportion of Slovaks and percentage of population with at least master's degree education in the United States with a correlation coefficient (R) of 0.041 and weighted average of 14.9%, a difference of 23.6%.
Master's Degree Correlation Summary
| Measurement | Asian | Slovak |
| Minimum | 4.2% | 1.0% |
| Maximum | 44.3% | 34.2% |
| Range | 40.2% | 33.1% |
| Mean | 20.7% | 10.1% |
| Median | 19.3% | 9.5% |
| Interquartile 25% (IQ1) | 16.8% | 6.9% |
| Interquartile 75% (IQ3) | 24.2% | 12.8% |
| Interquartile Range (IQR) | 7.4% | 5.9% |
| Standard Deviation (Sample) | 7.5% | 5.5% |
| Standard Deviation (Population) | 7.5% | 5.5% |
Similar Demographics by Master's Degree
Demographics Similar to Asians by Master's Degree
In terms of master's degree, the demographic groups most similar to Asians are Immigrants from Asia (18.4%, a difference of 0.14%), Immigrants from Serbia (18.5%, a difference of 0.22%), Immigrants from Lithuania (18.5%, a difference of 0.26%), Australian (18.4%, a difference of 0.27%), and Immigrants from Czechoslovakia (18.5%, a difference of 0.57%).
| Demographics | Rating | Rank | Master's Degree |
| Estonians | 100.0 /100 | #49 | Exceptional 18.8% |
| Bulgarians | 100.0 /100 | #50 | Exceptional 18.8% |
| Immigrants | South Africa | 100.0 /100 | #51 | Exceptional 18.8% |
| Immigrants | Kuwait | 100.0 /100 | #52 | Exceptional 18.6% |
| Immigrants | Czechoslovakia | 99.9 /100 | #53 | Exceptional 18.5% |
| Immigrants | Lithuania | 99.9 /100 | #54 | Exceptional 18.5% |
| Immigrants | Serbia | 99.9 /100 | #55 | Exceptional 18.5% |
| Asians | 99.9 /100 | #56 | Exceptional 18.4% |
| Immigrants | Asia | 99.9 /100 | #57 | Exceptional 18.4% |
| Australians | 99.9 /100 | #58 | Exceptional 18.4% |
| Immigrants | Bulgaria | 99.9 /100 | #59 | Exceptional 18.3% |
| New Zealanders | 99.9 /100 | #60 | Exceptional 18.3% |
| Immigrants | Europe | 99.9 /100 | #61 | Exceptional 18.2% |
| Argentineans | 99.9 /100 | #62 | Exceptional 18.2% |
| Immigrants | Netherlands | 99.9 /100 | #63 | Exceptional 18.1% |
Demographics Similar to Slovaks by Master's Degree
In terms of master's degree, the demographic groups most similar to Slovaks are Immigrants from Peru (14.9%, a difference of 0.050%), Nigerian (14.9%, a difference of 0.18%), Immigrants from Colombia (14.9%, a difference of 0.21%), Costa Rican (15.0%, a difference of 0.32%), and Immigrants from Uruguay (15.0%, a difference of 0.36%).
| Demographics | Rating | Rank | Master's Degree |
| Senegalese | 65.6 /100 | #167 | Good 15.2% |
| Immigrants | North Macedonia | 64.5 /100 | #168 | Good 15.2% |
| Scottish | 62.7 /100 | #169 | Good 15.2% |
| Irish | 56.3 /100 | #170 | Average 15.0% |
| Immigrants | Ghana | 53.6 /100 | #171 | Average 15.0% |
| Immigrants | Uruguay | 52.8 /100 | #172 | Average 15.0% |
| Costa Ricans | 52.5 /100 | #173 | Average 15.0% |
| Slovaks | 50.0 /100 | #174 | Average 14.9% |
| Immigrants | Peru | 49.6 /100 | #175 | Average 14.9% |
| Nigerians | 48.6 /100 | #176 | Average 14.9% |
| Immigrants | Colombia | 48.3 /100 | #177 | Average 14.9% |
| English | 45.0 /100 | #178 | Average 14.8% |
| Immigrants | Iraq | 41.3 /100 | #179 | Average 14.8% |
| Celtics | 41.3 /100 | #180 | Average 14.8% |
| Swiss | 41.1 /100 | #181 | Average 14.7% |