Asian vs Immigrants from Senegal Master's Degree
COMPARE
Asian
Immigrants from Senegal
Master's Degree
Master's Degree Comparison
Asians
Immigrants from Senegal
18.4%
MASTER'S DEGREE
99.9/ 100
METRIC RATING
56th/ 347
METRIC RANK
15.5%
MASTER'S DEGREE
78.2/ 100
METRIC RATING
148th/ 347
METRIC RANK
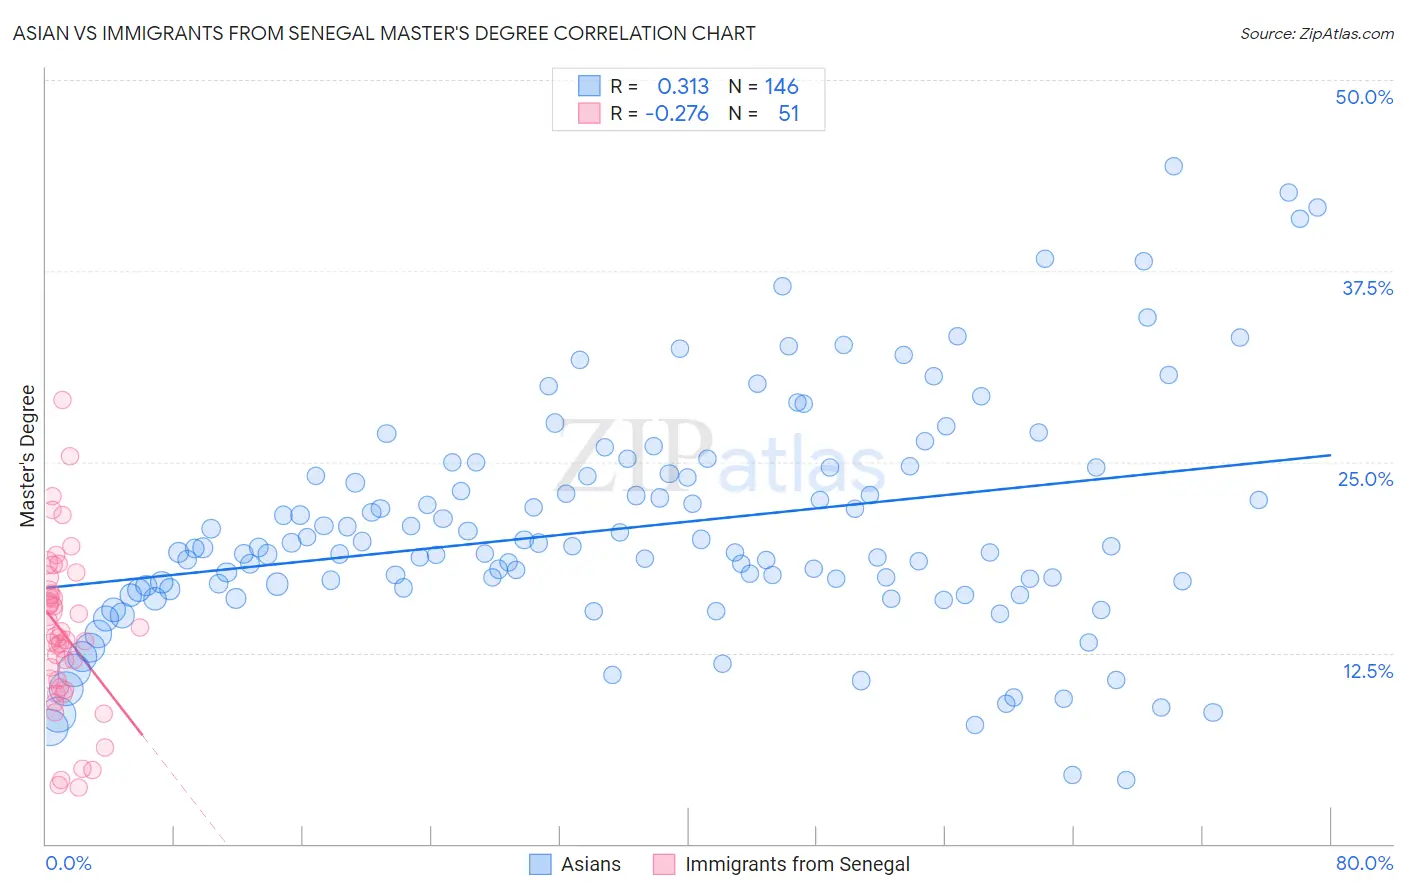
Asian vs Immigrants from Senegal Master's Degree Correlation Chart
The statistical analysis conducted on geographies consisting of 550,412,618 people shows a mild positive correlation between the proportion of Asians and percentage of population with at least master's degree education in the United States with a correlation coefficient (R) of 0.313 and weighted average of 18.4%. Similarly, the statistical analysis conducted on geographies consisting of 90,124,695 people shows a weak negative correlation between the proportion of Immigrants from Senegal and percentage of population with at least master's degree education in the United States with a correlation coefficient (R) of -0.276 and weighted average of 15.5%, a difference of 18.8%.
Master's Degree Correlation Summary
| Measurement | Asian | Immigrants from Senegal |
| Minimum | 4.2% | 3.7% |
| Maximum | 44.3% | 29.1% |
| Range | 40.2% | 25.4% |
| Mean | 20.7% | 13.8% |
| Median | 19.3% | 13.5% |
| Interquartile 25% (IQ1) | 16.8% | 10.3% |
| Interquartile 75% (IQ3) | 24.2% | 16.6% |
| Interquartile Range (IQR) | 7.4% | 6.3% |
| Standard Deviation (Sample) | 7.5% | 5.4% |
| Standard Deviation (Population) | 7.5% | 5.3% |
Similar Demographics by Master's Degree
Demographics Similar to Asians by Master's Degree
In terms of master's degree, the demographic groups most similar to Asians are Immigrants from Asia (18.4%, a difference of 0.14%), Immigrants from Serbia (18.5%, a difference of 0.22%), Immigrants from Lithuania (18.5%, a difference of 0.26%), Australian (18.4%, a difference of 0.27%), and Immigrants from Czechoslovakia (18.5%, a difference of 0.57%).
| Demographics | Rating | Rank | Master's Degree |
| Estonians | 100.0 /100 | #49 | Exceptional 18.8% |
| Bulgarians | 100.0 /100 | #50 | Exceptional 18.8% |
| Immigrants | South Africa | 100.0 /100 | #51 | Exceptional 18.8% |
| Immigrants | Kuwait | 100.0 /100 | #52 | Exceptional 18.6% |
| Immigrants | Czechoslovakia | 99.9 /100 | #53 | Exceptional 18.5% |
| Immigrants | Lithuania | 99.9 /100 | #54 | Exceptional 18.5% |
| Immigrants | Serbia | 99.9 /100 | #55 | Exceptional 18.5% |
| Asians | 99.9 /100 | #56 | Exceptional 18.4% |
| Immigrants | Asia | 99.9 /100 | #57 | Exceptional 18.4% |
| Australians | 99.9 /100 | #58 | Exceptional 18.4% |
| Immigrants | Bulgaria | 99.9 /100 | #59 | Exceptional 18.3% |
| New Zealanders | 99.9 /100 | #60 | Exceptional 18.3% |
| Immigrants | Europe | 99.9 /100 | #61 | Exceptional 18.2% |
| Argentineans | 99.9 /100 | #62 | Exceptional 18.2% |
| Immigrants | Netherlands | 99.9 /100 | #63 | Exceptional 18.1% |
Demographics Similar to Immigrants from Senegal by Master's Degree
In terms of master's degree, the demographic groups most similar to Immigrants from Senegal are Ghanaian (15.5%, a difference of 0.010%), Slovene (15.5%, a difference of 0.040%), Iraqi (15.5%, a difference of 0.16%), Hungarian (15.6%, a difference of 0.17%), and Immigrants from Afghanistan (15.6%, a difference of 0.21%).
| Demographics | Rating | Rank | Master's Degree |
| Poles | 85.0 /100 | #141 | Excellent 15.7% |
| Immigrants | Africa | 84.0 /100 | #142 | Excellent 15.7% |
| Immigrants | Venezuela | 83.6 /100 | #143 | Excellent 15.7% |
| Canadians | 83.3 /100 | #144 | Excellent 15.7% |
| South Americans | 81.3 /100 | #145 | Excellent 15.6% |
| Immigrants | Afghanistan | 79.4 /100 | #146 | Good 15.6% |
| Hungarians | 79.1 /100 | #147 | Good 15.6% |
| Immigrants | Senegal | 78.2 /100 | #148 | Good 15.5% |
| Ghanaians | 78.2 /100 | #149 | Good 15.5% |
| Slovenes | 78.0 /100 | #150 | Good 15.5% |
| Iraqis | 77.3 /100 | #151 | Good 15.5% |
| Slavs | 77.0 /100 | #152 | Good 15.5% |
| Icelanders | 76.8 /100 | #153 | Good 15.5% |
| Immigrants | South America | 76.3 /100 | #154 | Good 15.5% |
| Immigrants | Bangladesh | 76.1 /100 | #155 | Good 15.5% |