Asian vs South American Indian Master's Degree
COMPARE
Asian
South American Indian
Master's Degree
Master's Degree Comparison
Asians
South American Indians
18.4%
MASTER'S DEGREE
99.9/ 100
METRIC RATING
56th/ 347
METRIC RANK
15.9%
MASTER'S DEGREE
88.4/ 100
METRIC RATING
135th/ 347
METRIC RANK
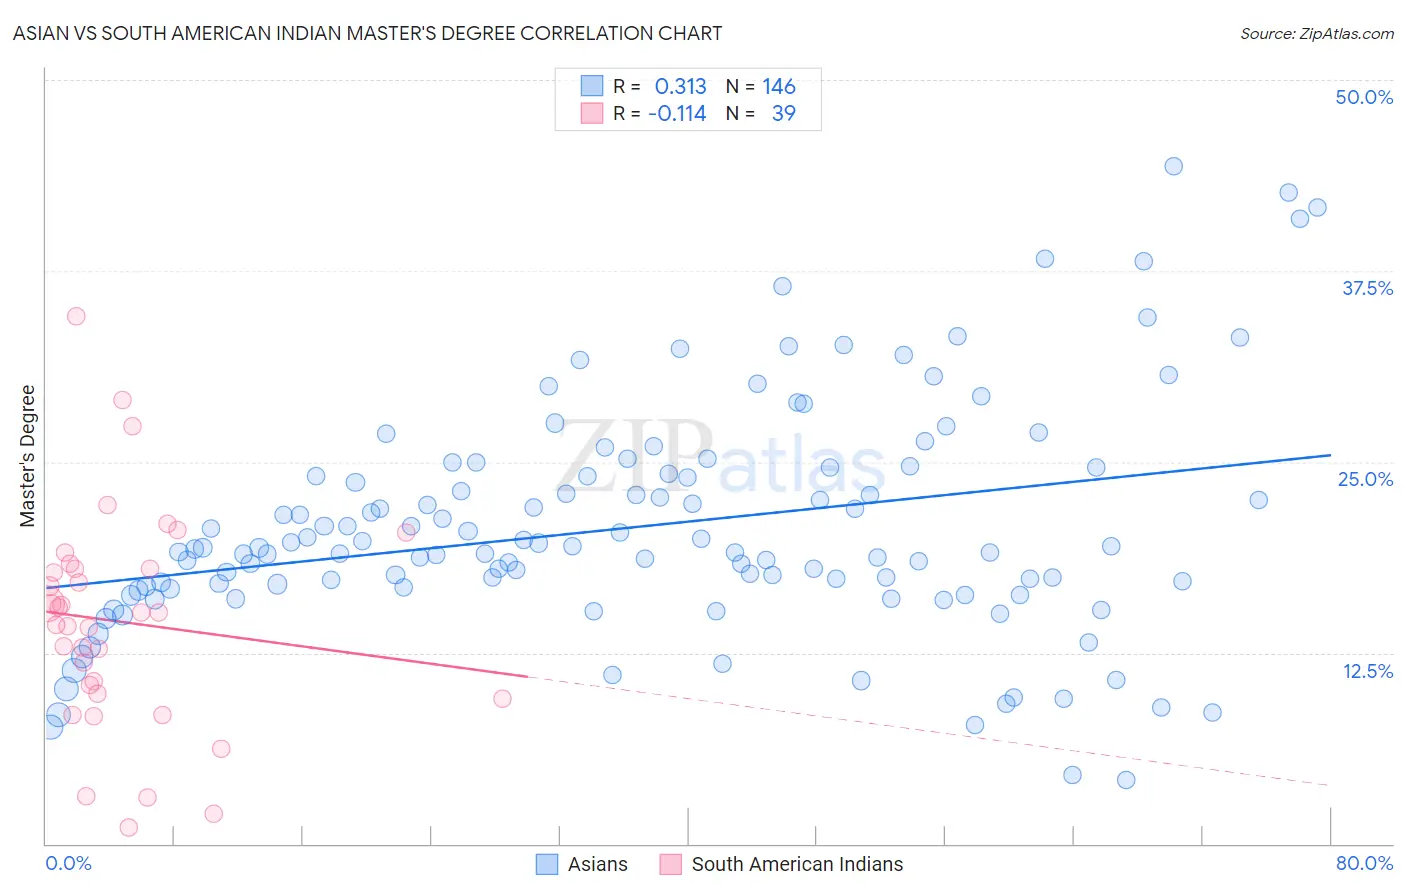
Asian vs South American Indian Master's Degree Correlation Chart
The statistical analysis conducted on geographies consisting of 550,412,618 people shows a mild positive correlation between the proportion of Asians and percentage of population with at least master's degree education in the United States with a correlation coefficient (R) of 0.313 and weighted average of 18.4%. Similarly, the statistical analysis conducted on geographies consisting of 164,560,944 people shows a poor negative correlation between the proportion of South American Indians and percentage of population with at least master's degree education in the United States with a correlation coefficient (R) of -0.114 and weighted average of 15.9%, a difference of 16.1%.
Master's Degree Correlation Summary
| Measurement | Asian | South American Indian |
| Minimum | 4.2% | 1.1% |
| Maximum | 44.3% | 34.5% |
| Range | 40.2% | 33.5% |
| Mean | 20.7% | 14.5% |
| Median | 19.3% | 15.1% |
| Interquartile 25% (IQ1) | 16.8% | 9.8% |
| Interquartile 75% (IQ3) | 24.2% | 18.0% |
| Interquartile Range (IQR) | 7.4% | 8.2% |
| Standard Deviation (Sample) | 7.5% | 7.1% |
| Standard Deviation (Population) | 7.5% | 7.0% |
Similar Demographics by Master's Degree
Demographics Similar to Asians by Master's Degree
In terms of master's degree, the demographic groups most similar to Asians are Immigrants from Asia (18.4%, a difference of 0.14%), Immigrants from Serbia (18.5%, a difference of 0.22%), Immigrants from Lithuania (18.5%, a difference of 0.26%), Australian (18.4%, a difference of 0.27%), and Immigrants from Czechoslovakia (18.5%, a difference of 0.57%).
| Demographics | Rating | Rank | Master's Degree |
| Estonians | 100.0 /100 | #49 | Exceptional 18.8% |
| Bulgarians | 100.0 /100 | #50 | Exceptional 18.8% |
| Immigrants | South Africa | 100.0 /100 | #51 | Exceptional 18.8% |
| Immigrants | Kuwait | 100.0 /100 | #52 | Exceptional 18.6% |
| Immigrants | Czechoslovakia | 99.9 /100 | #53 | Exceptional 18.5% |
| Immigrants | Lithuania | 99.9 /100 | #54 | Exceptional 18.5% |
| Immigrants | Serbia | 99.9 /100 | #55 | Exceptional 18.5% |
| Asians | 99.9 /100 | #56 | Exceptional 18.4% |
| Immigrants | Asia | 99.9 /100 | #57 | Exceptional 18.4% |
| Australians | 99.9 /100 | #58 | Exceptional 18.4% |
| Immigrants | Bulgaria | 99.9 /100 | #59 | Exceptional 18.3% |
| New Zealanders | 99.9 /100 | #60 | Exceptional 18.3% |
| Immigrants | Europe | 99.9 /100 | #61 | Exceptional 18.2% |
| Argentineans | 99.9 /100 | #62 | Exceptional 18.2% |
| Immigrants | Netherlands | 99.9 /100 | #63 | Exceptional 18.1% |
Demographics Similar to South American Indians by Master's Degree
In terms of master's degree, the demographic groups most similar to South American Indians are Venezuelan (15.9%, a difference of 0.0%), Assyrian/Chaldean/Syriac (15.8%, a difference of 0.45%), European (15.8%, a difference of 0.55%), Immigrants from Sudan (16.0%, a difference of 0.56%), and Pakistani (15.8%, a difference of 0.63%).
| Demographics | Rating | Rank | Master's Degree |
| Immigrants | Sierra Leone | 94.7 /100 | #128 | Exceptional 16.3% |
| Immigrants | Syria | 93.3 /100 | #129 | Exceptional 16.2% |
| Immigrants | Jordan | 92.7 /100 | #130 | Exceptional 16.1% |
| Taiwanese | 91.9 /100 | #131 | Exceptional 16.1% |
| Serbians | 91.7 /100 | #132 | Exceptional 16.1% |
| Immigrants | Sudan | 90.2 /100 | #133 | Exceptional 16.0% |
| Venezuelans | 88.4 /100 | #134 | Excellent 15.9% |
| South American Indians | 88.4 /100 | #135 | Excellent 15.9% |
| Assyrians/Chaldeans/Syriacs | 86.8 /100 | #136 | Excellent 15.8% |
| Europeans | 86.4 /100 | #137 | Excellent 15.8% |
| Pakistanis | 86.1 /100 | #138 | Excellent 15.8% |
| Immigrants | Germany | 85.9 /100 | #139 | Excellent 15.8% |
| Vietnamese | 85.5 /100 | #140 | Excellent 15.8% |
| Poles | 85.0 /100 | #141 | Excellent 15.7% |
| Immigrants | Africa | 84.0 /100 | #142 | Excellent 15.7% |