Asian vs Immigrants from Laos No Vehicles in Household
COMPARE
Asian
Immigrants from Laos
No Vehicles in Household
No Vehicles in Household Comparison
Asians
Immigrants from Laos
9.0%
NO VEHICLES IN HOUSEHOLD
98.3/ 100
METRIC RATING
100th/ 347
METRIC RANK
8.2%
NO VEHICLES IN HOUSEHOLD
99.8/ 100
METRIC RATING
60th/ 347
METRIC RANK
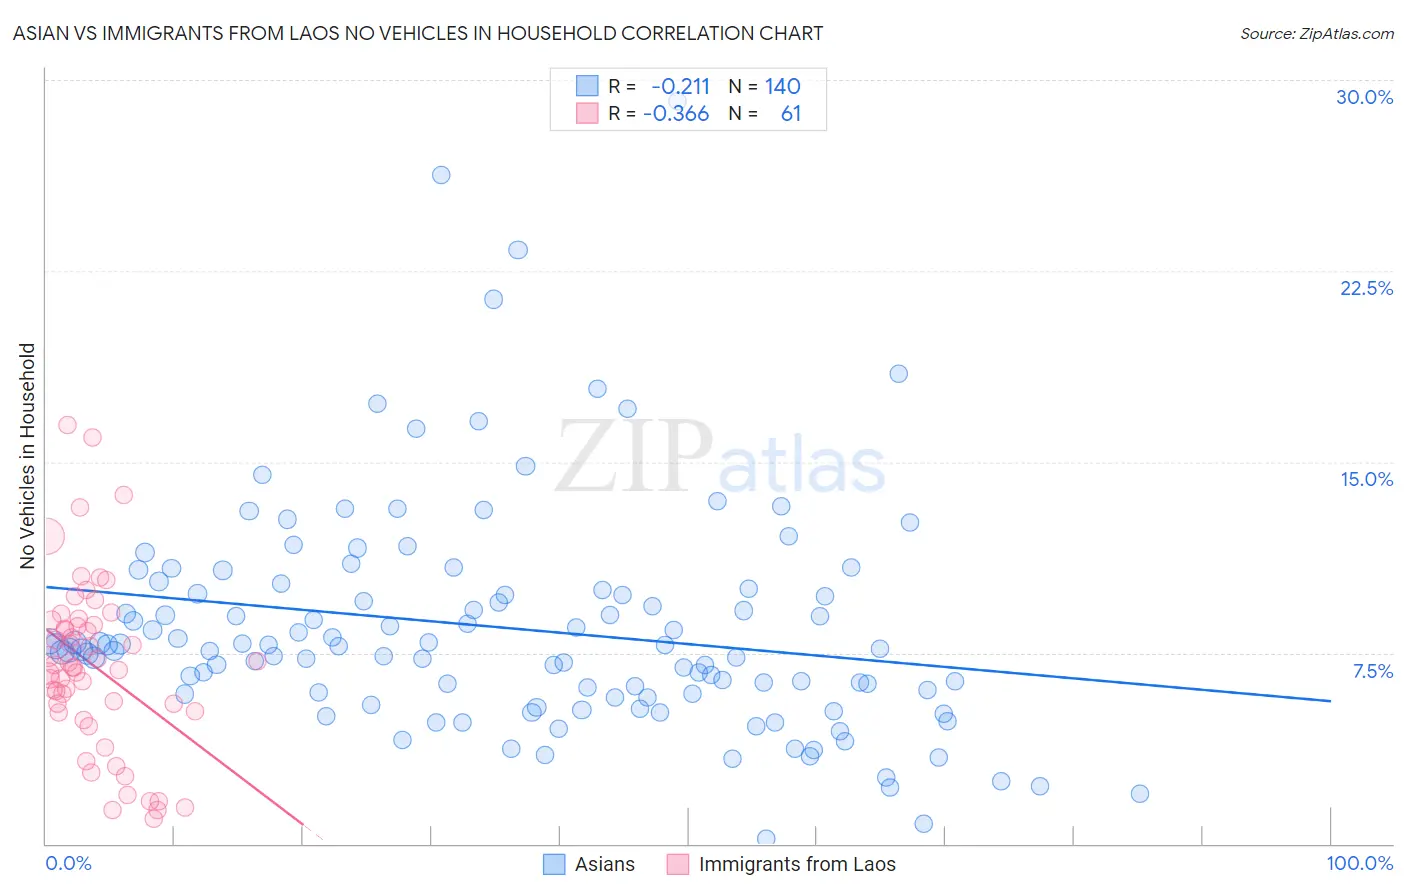
Asian vs Immigrants from Laos No Vehicles in Household Correlation Chart
The statistical analysis conducted on geographies consisting of 534,555,995 people shows a weak negative correlation between the proportion of Asians and percentage of households with no vehicle available in the United States with a correlation coefficient (R) of -0.211 and weighted average of 9.0%. Similarly, the statistical analysis conducted on geographies consisting of 201,284,656 people shows a mild negative correlation between the proportion of Immigrants from Laos and percentage of households with no vehicle available in the United States with a correlation coefficient (R) of -0.366 and weighted average of 8.2%, a difference of 9.8%.
No Vehicles in Household Correlation Summary
| Measurement | Asian | Immigrants from Laos |
| Minimum | 0.21% | 0.99% |
| Maximum | 29.2% | 16.5% |
| Range | 29.0% | 15.5% |
| Mean | 8.5% | 7.0% |
| Median | 7.7% | 6.9% |
| Interquartile 25% (IQ1) | 5.9% | 5.2% |
| Interquartile 75% (IQ3) | 9.9% | 8.7% |
| Interquartile Range (IQR) | 4.0% | 3.5% |
| Standard Deviation (Sample) | 4.5% | 3.4% |
| Standard Deviation (Population) | 4.5% | 3.4% |
Similar Demographics by No Vehicles in Household
Demographics Similar to Asians by No Vehicles in Household
In terms of no vehicles in household, the demographic groups most similar to Asians are Pakistani (9.0%, a difference of 0.040%), Yugoslavian (9.0%, a difference of 0.080%), Seminole (9.0%, a difference of 0.080%), Bulgarian (9.0%, a difference of 0.18%), and Slavic (9.0%, a difference of 0.24%).
| Demographics | Rating | Rank | No Vehicles in Household |
| Immigrants | North America | 99.1 /100 | #93 | Exceptional 8.7% |
| Austrians | 98.9 /100 | #94 | Exceptional 8.8% |
| Potawatomi | 98.8 /100 | #95 | Exceptional 8.8% |
| Immigrants | Bolivia | 98.7 /100 | #96 | Exceptional 8.9% |
| Immigrants | Central America | 98.5 /100 | #97 | Exceptional 8.9% |
| Slavs | 98.4 /100 | #98 | Exceptional 9.0% |
| Bulgarians | 98.4 /100 | #99 | Exceptional 9.0% |
| Asians | 98.3 /100 | #100 | Exceptional 9.0% |
| Pakistanis | 98.3 /100 | #101 | Exceptional 9.0% |
| Yugoslavians | 98.3 /100 | #102 | Exceptional 9.0% |
| Seminole | 98.3 /100 | #103 | Exceptional 9.0% |
| Zimbabweans | 98.0 /100 | #104 | Exceptional 9.0% |
| Spanish Americans | 97.9 /100 | #105 | Exceptional 9.1% |
| Laotians | 97.8 /100 | #106 | Exceptional 9.1% |
| Hispanics or Latinos | 97.7 /100 | #107 | Exceptional 9.1% |
Demographics Similar to Immigrants from Laos by No Vehicles in Household
In terms of no vehicles in household, the demographic groups most similar to Immigrants from Laos are Immigrants from India (8.2%, a difference of 0.070%), Thai (8.2%, a difference of 0.17%), Immigrants from Mexico (8.1%, a difference of 0.42%), Venezuelan (8.1%, a difference of 0.53%), and Chinese (8.2%, a difference of 0.62%).
| Demographics | Rating | Rank | No Vehicles in Household |
| Slovenes | 99.9 /100 | #53 | Exceptional 8.0% |
| Immigrants | Venezuela | 99.9 /100 | #54 | Exceptional 8.1% |
| Celtics | 99.9 /100 | #55 | Exceptional 8.1% |
| Immigrants | Afghanistan | 99.9 /100 | #56 | Exceptional 8.1% |
| Venezuelans | 99.8 /100 | #57 | Exceptional 8.1% |
| Immigrants | Mexico | 99.8 /100 | #58 | Exceptional 8.1% |
| Immigrants | India | 99.8 /100 | #59 | Exceptional 8.2% |
| Immigrants | Laos | 99.8 /100 | #60 | Exceptional 8.2% |
| Thais | 99.8 /100 | #61 | Exceptional 8.2% |
| Chinese | 99.8 /100 | #62 | Exceptional 8.2% |
| Slovaks | 99.8 /100 | #63 | Exceptional 8.3% |
| Croatians | 99.8 /100 | #64 | Exceptional 8.3% |
| Canadians | 99.7 /100 | #65 | Exceptional 8.3% |
| Palestinians | 99.7 /100 | #66 | Exceptional 8.3% |
| Immigrants | Scotland | 99.7 /100 | #67 | Exceptional 8.3% |