Asian vs Immigrants from Romania Master's Degree
COMPARE
Asian
Immigrants from Romania
Master's Degree
Master's Degree Comparison
Asians
Immigrants from Romania
18.4%
MASTER'S DEGREE
99.9/ 100
METRIC RATING
56th/ 347
METRIC RANK
17.7%
MASTER'S DEGREE
99.7/ 100
METRIC RATING
74th/ 347
METRIC RANK
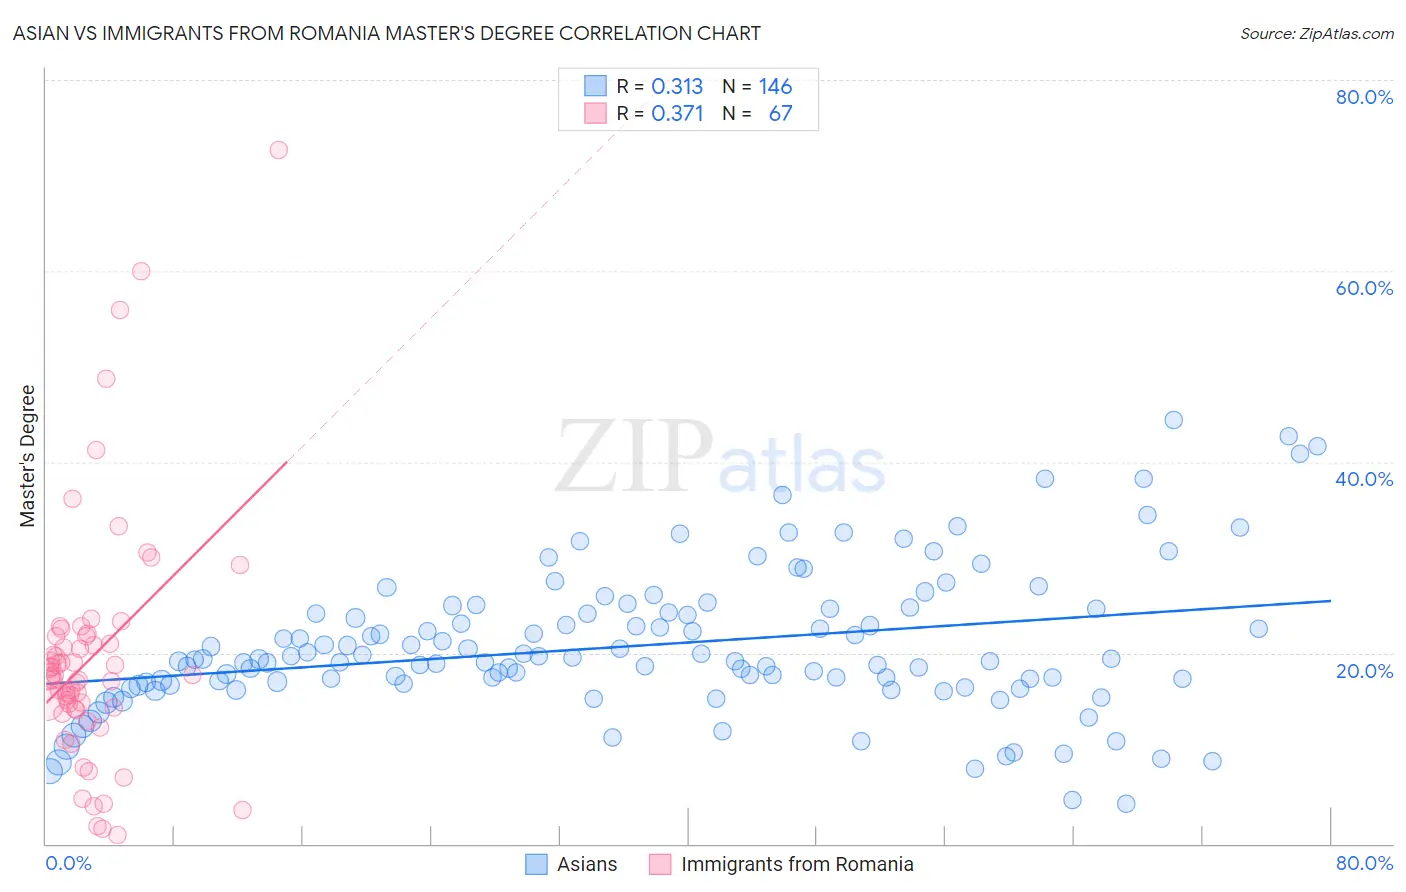
Asian vs Immigrants from Romania Master's Degree Correlation Chart
The statistical analysis conducted on geographies consisting of 550,412,618 people shows a mild positive correlation between the proportion of Asians and percentage of population with at least master's degree education in the United States with a correlation coefficient (R) of 0.313 and weighted average of 18.4%. Similarly, the statistical analysis conducted on geographies consisting of 256,994,499 people shows a mild positive correlation between the proportion of Immigrants from Romania and percentage of population with at least master's degree education in the United States with a correlation coefficient (R) of 0.371 and weighted average of 17.7%, a difference of 4.4%.
Master's Degree Correlation Summary
| Measurement | Asian | Immigrants from Romania |
| Minimum | 4.2% | 0.91% |
| Maximum | 44.3% | 72.6% |
| Range | 40.2% | 71.7% |
| Mean | 20.7% | 19.6% |
| Median | 19.3% | 17.5% |
| Interquartile 25% (IQ1) | 16.8% | 14.1% |
| Interquartile 75% (IQ3) | 24.2% | 21.8% |
| Interquartile Range (IQR) | 7.4% | 7.7% |
| Standard Deviation (Sample) | 7.5% | 12.9% |
| Standard Deviation (Population) | 7.5% | 12.8% |
Demographics Similar to Asians and Immigrants from Romania by Master's Degree
In terms of master's degree, the demographic groups most similar to Asians are Immigrants from Asia (18.4%, a difference of 0.14%), Immigrants from Serbia (18.5%, a difference of 0.22%), Australian (18.4%, a difference of 0.27%), Immigrants from Bulgaria (18.3%, a difference of 0.71%), and New Zealander (18.3%, a difference of 0.93%). Similarly, the demographic groups most similar to Immigrants from Romania are Zimbabwean (17.7%, a difference of 0.31%), Egyptian (17.6%, a difference of 0.38%), Lithuanian (17.7%, a difference of 0.41%), Immigrants from Pakistan (17.8%, a difference of 0.59%), and Immigrants from Western Europe (17.8%, a difference of 0.87%).
| Demographics | Rating | Rank | Master's Degree |
| Immigrants | Serbia | 99.9 /100 | #55 | Exceptional 18.5% |
| Asians | 99.9 /100 | #56 | Exceptional 18.4% |
| Immigrants | Asia | 99.9 /100 | #57 | Exceptional 18.4% |
| Australians | 99.9 /100 | #58 | Exceptional 18.4% |
| Immigrants | Bulgaria | 99.9 /100 | #59 | Exceptional 18.3% |
| New Zealanders | 99.9 /100 | #60 | Exceptional 18.3% |
| Immigrants | Europe | 99.9 /100 | #61 | Exceptional 18.2% |
| Argentineans | 99.9 /100 | #62 | Exceptional 18.2% |
| Immigrants | Netherlands | 99.9 /100 | #63 | Exceptional 18.1% |
| South Africans | 99.9 /100 | #64 | Exceptional 18.1% |
| Immigrants | Kazakhstan | 99.8 /100 | #65 | Exceptional 18.0% |
| Ethiopians | 99.8 /100 | #66 | Exceptional 18.0% |
| Immigrants | Argentina | 99.8 /100 | #67 | Exceptional 18.0% |
| Immigrants | Ethiopia | 99.8 /100 | #68 | Exceptional 17.9% |
| Immigrants | Uzbekistan | 99.8 /100 | #69 | Exceptional 17.9% |
| Immigrants | Western Europe | 99.8 /100 | #70 | Exceptional 17.8% |
| Immigrants | Pakistan | 99.7 /100 | #71 | Exceptional 17.8% |
| Lithuanians | 99.7 /100 | #72 | Exceptional 17.7% |
| Zimbabweans | 99.7 /100 | #73 | Exceptional 17.7% |
| Immigrants | Romania | 99.7 /100 | #74 | Exceptional 17.7% |
| Egyptians | 99.6 /100 | #75 | Exceptional 17.6% |