Arab vs Immigrants from Belarus GED/Equivalency
COMPARE
Arab
Immigrants from Belarus
GED/Equivalency
GED/Equivalency Comparison
Arabs
Immigrants from Belarus
86.6%
GED/EQUIVALENCY
86.7/ 100
METRIC RATING
137th/ 347
METRIC RANK
87.3%
GED/EQUIVALENCY
96.9/ 100
METRIC RATING
99th/ 347
METRIC RANK
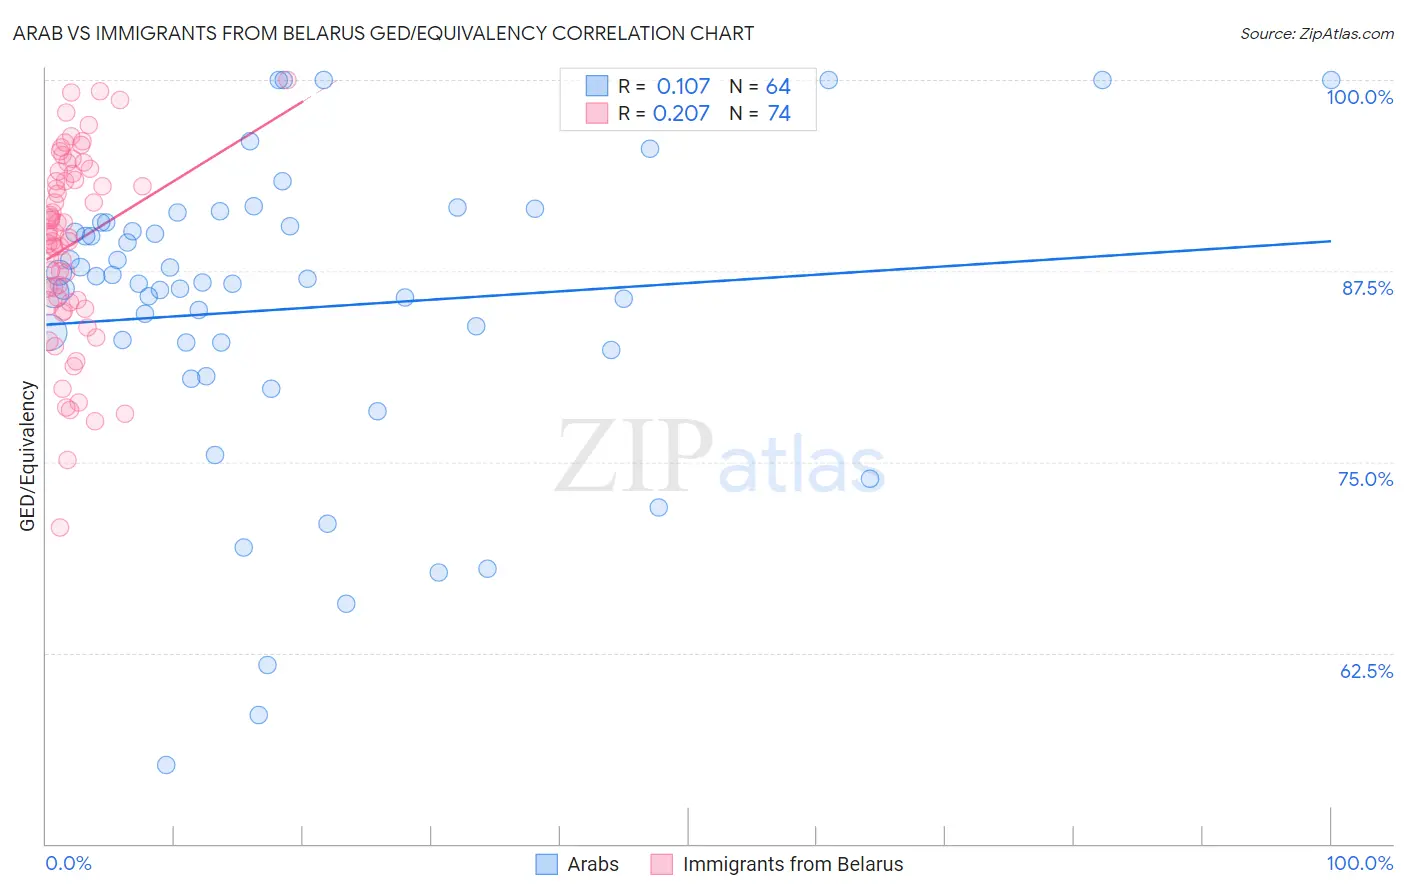
Arab vs Immigrants from Belarus GED/Equivalency Correlation Chart
The statistical analysis conducted on geographies consisting of 486,870,847 people shows a poor positive correlation between the proportion of Arabs and percentage of population with at least ged/equivalency education in the United States with a correlation coefficient (R) of 0.107 and weighted average of 86.6%. Similarly, the statistical analysis conducted on geographies consisting of 150,205,158 people shows a weak positive correlation between the proportion of Immigrants from Belarus and percentage of population with at least ged/equivalency education in the United States with a correlation coefficient (R) of 0.207 and weighted average of 87.3%, a difference of 0.79%.
GED/Equivalency Correlation Summary
| Measurement | Arab | Immigrants from Belarus |
| Minimum | 55.1% | 70.7% |
| Maximum | 100.0% | 100.0% |
| Range | 44.9% | 29.3% |
| Mean | 85.0% | 89.2% |
| Median | 86.7% | 89.9% |
| Interquartile 25% (IQ1) | 82.6% | 85.4% |
| Interquartile 75% (IQ3) | 90.6% | 93.9% |
| Interquartile Range (IQR) | 8.0% | 8.4% |
| Standard Deviation (Sample) | 9.9% | 6.2% |
| Standard Deviation (Population) | 9.9% | 6.1% |
Similar Demographics by GED/Equivalency
Demographics Similar to Arabs by GED/Equivalency
In terms of ged/equivalency, the demographic groups most similar to Arabs are Chilean (86.6%, a difference of 0.010%), Immigrants from Argentina (86.6%, a difference of 0.010%), Immigrants from Asia (86.6%, a difference of 0.030%), Albanian (86.6%, a difference of 0.040%), and Immigrants from Malaysia (86.5%, a difference of 0.070%).
| Demographics | Rating | Rank | GED/Equivalency |
| Immigrants | Germany | 88.8 /100 | #130 | Excellent 86.7% |
| Immigrants | Spain | 88.5 /100 | #131 | Excellent 86.7% |
| Immigrants | Brazil | 88.4 /100 | #132 | Excellent 86.6% |
| Tsimshian | 88.3 /100 | #133 | Excellent 86.6% |
| Albanians | 87.7 /100 | #134 | Excellent 86.6% |
| Immigrants | Asia | 87.4 /100 | #135 | Excellent 86.6% |
| Chileans | 86.9 /100 | #136 | Excellent 86.6% |
| Arabs | 86.7 /100 | #137 | Excellent 86.6% |
| Immigrants | Argentina | 86.5 /100 | #138 | Excellent 86.6% |
| Immigrants | Malaysia | 85.0 /100 | #139 | Excellent 86.5% |
| Paraguayans | 84.1 /100 | #140 | Excellent 86.5% |
| Laotians | 83.2 /100 | #141 | Excellent 86.5% |
| Immigrants | Indonesia | 82.4 /100 | #142 | Excellent 86.4% |
| Immigrants | Pakistan | 82.4 /100 | #143 | Excellent 86.4% |
| Bolivians | 82.1 /100 | #144 | Excellent 86.4% |
Demographics Similar to Immigrants from Belarus by GED/Equivalency
In terms of ged/equivalency, the demographic groups most similar to Immigrants from Belarus are Immigrants from Croatia (87.3%, a difference of 0.010%), Palestinian (87.3%, a difference of 0.020%), Syrian (87.2%, a difference of 0.050%), Immigrants from Western Europe (87.3%, a difference of 0.070%), and Lebanese (87.2%, a difference of 0.11%).
| Demographics | Rating | Rank | GED/Equivalency |
| Israelis | 97.8 /100 | #92 | Exceptional 87.4% |
| Immigrants | North Macedonia | 97.8 /100 | #93 | Exceptional 87.4% |
| Immigrants | Russia | 97.8 /100 | #94 | Exceptional 87.4% |
| Immigrants | Greece | 97.7 /100 | #95 | Exceptional 87.4% |
| Czechoslovakians | 97.6 /100 | #96 | Exceptional 87.4% |
| Immigrants | Western Europe | 97.3 /100 | #97 | Exceptional 87.3% |
| Immigrants | Croatia | 96.9 /100 | #98 | Exceptional 87.3% |
| Immigrants | Belarus | 96.9 /100 | #99 | Exceptional 87.3% |
| Palestinians | 96.8 /100 | #100 | Exceptional 87.3% |
| Syrians | 96.6 /100 | #101 | Exceptional 87.2% |
| Lebanese | 96.2 /100 | #102 | Exceptional 87.2% |
| Jordanians | 96.1 /100 | #103 | Exceptional 87.2% |
| Immigrants | Hungary | 96.0 /100 | #104 | Exceptional 87.2% |
| Indians (Asian) | 95.9 /100 | #105 | Exceptional 87.1% |
| Immigrants | Zimbabwe | 95.8 /100 | #106 | Exceptional 87.1% |