Arab vs Immigrants from Belarus Doctorate Degree
COMPARE
Arab
Immigrants from Belarus
Doctorate Degree
Doctorate Degree Comparison
Arabs
Immigrants from Belarus
2.1%
DOCTORATE DEGREE
97.8/ 100
METRIC RATING
105th/ 347
METRIC RANK
2.2%
DOCTORATE DEGREE
99.7/ 100
METRIC RATING
78th/ 347
METRIC RANK
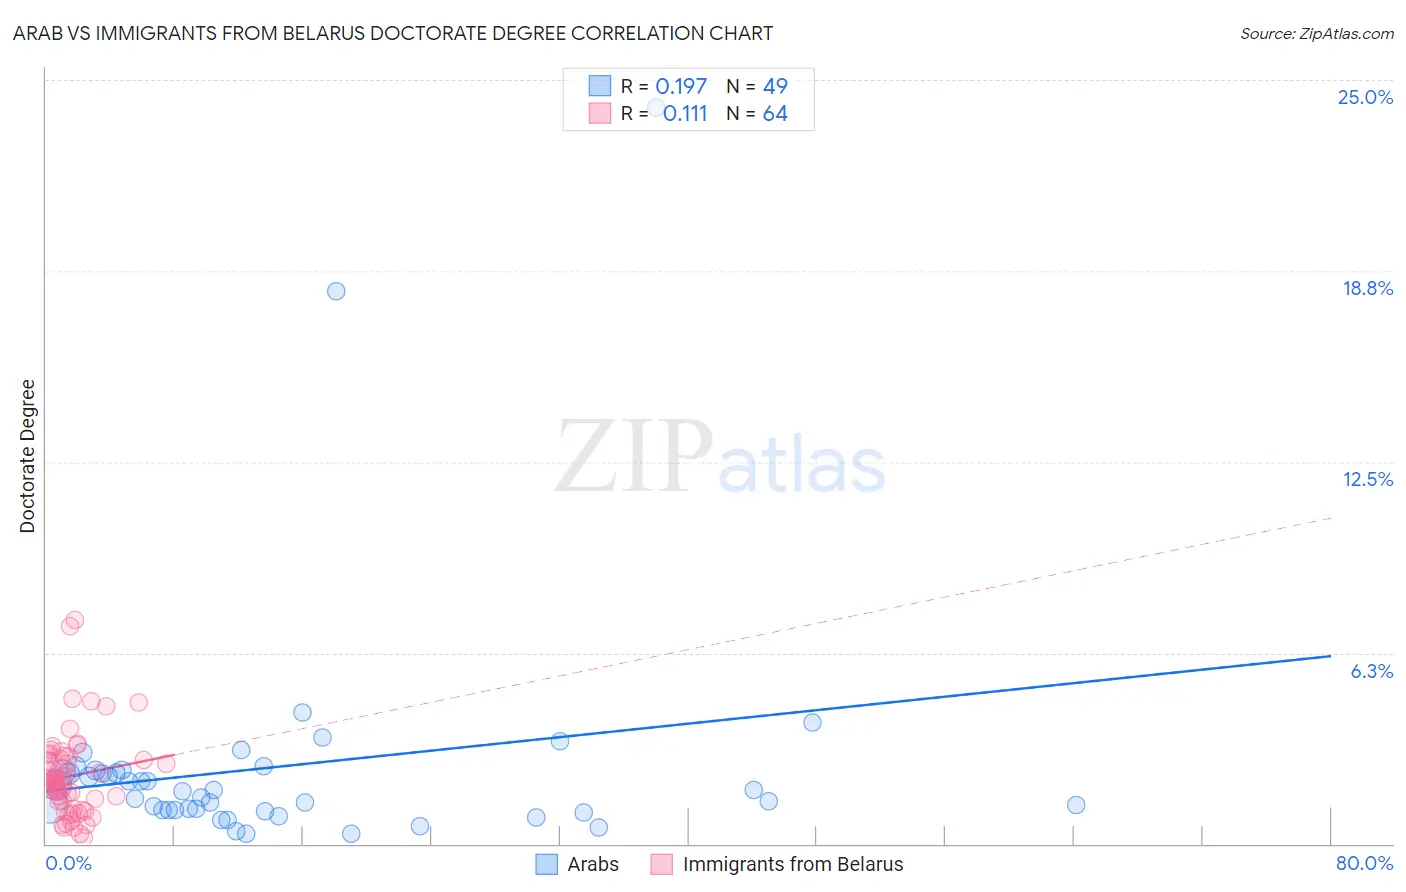
Arab vs Immigrants from Belarus Doctorate Degree Correlation Chart
The statistical analysis conducted on geographies consisting of 479,921,881 people shows a poor positive correlation between the proportion of Arabs and percentage of population with at least doctorate degree education in the United States with a correlation coefficient (R) of 0.197 and weighted average of 2.1%. Similarly, the statistical analysis conducted on geographies consisting of 150,000,226 people shows a poor positive correlation between the proportion of Immigrants from Belarus and percentage of population with at least doctorate degree education in the United States with a correlation coefficient (R) of 0.111 and weighted average of 2.2%, a difference of 6.7%.
Doctorate Degree Correlation Summary
| Measurement | Arab | Immigrants from Belarus |
| Minimum | 0.33% | 0.19% |
| Maximum | 24.1% | 7.3% |
| Range | 23.8% | 7.1% |
| Mean | 2.5% | 2.2% |
| Median | 1.7% | 2.0% |
| Interquartile 25% (IQ1) | 1.1% | 1.3% |
| Interquartile 75% (IQ3) | 2.4% | 2.8% |
| Interquartile Range (IQR) | 1.3% | 1.6% |
| Standard Deviation (Sample) | 4.0% | 1.4% |
| Standard Deviation (Population) | 4.0% | 1.4% |
Similar Demographics by Doctorate Degree
Demographics Similar to Arabs by Doctorate Degree
In terms of doctorate degree, the demographic groups most similar to Arabs are Sudanese (2.1%, a difference of 0.10%), Austrian (2.1%, a difference of 0.35%), Romanian (2.1%, a difference of 0.47%), Immigrants from Chile (2.1%, a difference of 0.48%), and European (2.1%, a difference of 0.49%).
| Demographics | Rating | Rank | Doctorate Degree |
| Armenians | 98.3 /100 | #98 | Exceptional 2.1% |
| Immigrants | Egypt | 98.2 /100 | #99 | Exceptional 2.1% |
| Immigrants | Eastern Europe | 98.2 /100 | #100 | Exceptional 2.1% |
| Immigrants | Eastern Africa | 98.2 /100 | #101 | Exceptional 2.1% |
| Immigrants | Chile | 98.1 /100 | #102 | Exceptional 2.1% |
| Romanians | 98.1 /100 | #103 | Exceptional 2.1% |
| Austrians | 98.0 /100 | #104 | Exceptional 2.1% |
| Arabs | 97.8 /100 | #105 | Exceptional 2.1% |
| Sudanese | 97.7 /100 | #106 | Exceptional 2.1% |
| Europeans | 97.5 /100 | #107 | Exceptional 2.1% |
| Immigrants | Germany | 97.3 /100 | #108 | Exceptional 2.1% |
| Ukrainians | 97.2 /100 | #109 | Exceptional 2.1% |
| Brazilians | 97.2 /100 | #110 | Exceptional 2.1% |
| Immigrants | Pakistan | 97.1 /100 | #111 | Exceptional 2.1% |
| Syrians | 97.1 /100 | #112 | Exceptional 2.1% |
Demographics Similar to Immigrants from Belarus by Doctorate Degree
In terms of doctorate degree, the demographic groups most similar to Immigrants from Belarus are Northern European (2.2%, a difference of 0.070%), Ugandan (2.2%, a difference of 0.35%), Immigrants from Argentina (2.2%, a difference of 0.40%), Immigrants from Lebanon (2.2%, a difference of 0.52%), and Immigrants from Hungary (2.2%, a difference of 0.53%).
| Demographics | Rating | Rank | Doctorate Degree |
| Immigrants | Bolivia | 99.8 /100 | #71 | Exceptional 2.3% |
| Immigrants | Canada | 99.8 /100 | #72 | Exceptional 2.3% |
| Immigrants | Bulgaria | 99.8 /100 | #73 | Exceptional 2.3% |
| Immigrants | North America | 99.8 /100 | #74 | Exceptional 2.2% |
| Immigrants | Western Asia | 99.8 /100 | #75 | Exceptional 2.2% |
| Immigrants | Hungary | 99.8 /100 | #76 | Exceptional 2.2% |
| Immigrants | Lebanon | 99.8 /100 | #77 | Exceptional 2.2% |
| Immigrants | Belarus | 99.7 /100 | #78 | Exceptional 2.2% |
| Northern Europeans | 99.7 /100 | #79 | Exceptional 2.2% |
| Ugandans | 99.7 /100 | #80 | Exceptional 2.2% |
| Immigrants | Argentina | 99.7 /100 | #81 | Exceptional 2.2% |
| Immigrants | Uganda | 99.6 /100 | #82 | Exceptional 2.2% |
| Immigrants | Lithuania | 99.6 /100 | #83 | Exceptional 2.2% |
| Immigrants | England | 99.6 /100 | #84 | Exceptional 2.2% |
| Immigrants | Brazil | 99.6 /100 | #85 | Exceptional 2.2% |