Immigrants from Ecuador vs Immigrants from Belarus GED/Equivalency
COMPARE
Immigrants from Ecuador
Immigrants from Belarus
GED/Equivalency
GED/Equivalency Comparison
Immigrants from Ecuador
Immigrants from Belarus
81.0%
GED/EQUIVALENCY
0.0/ 100
METRIC RATING
309th/ 347
METRIC RANK
87.3%
GED/EQUIVALENCY
96.9/ 100
METRIC RATING
99th/ 347
METRIC RANK
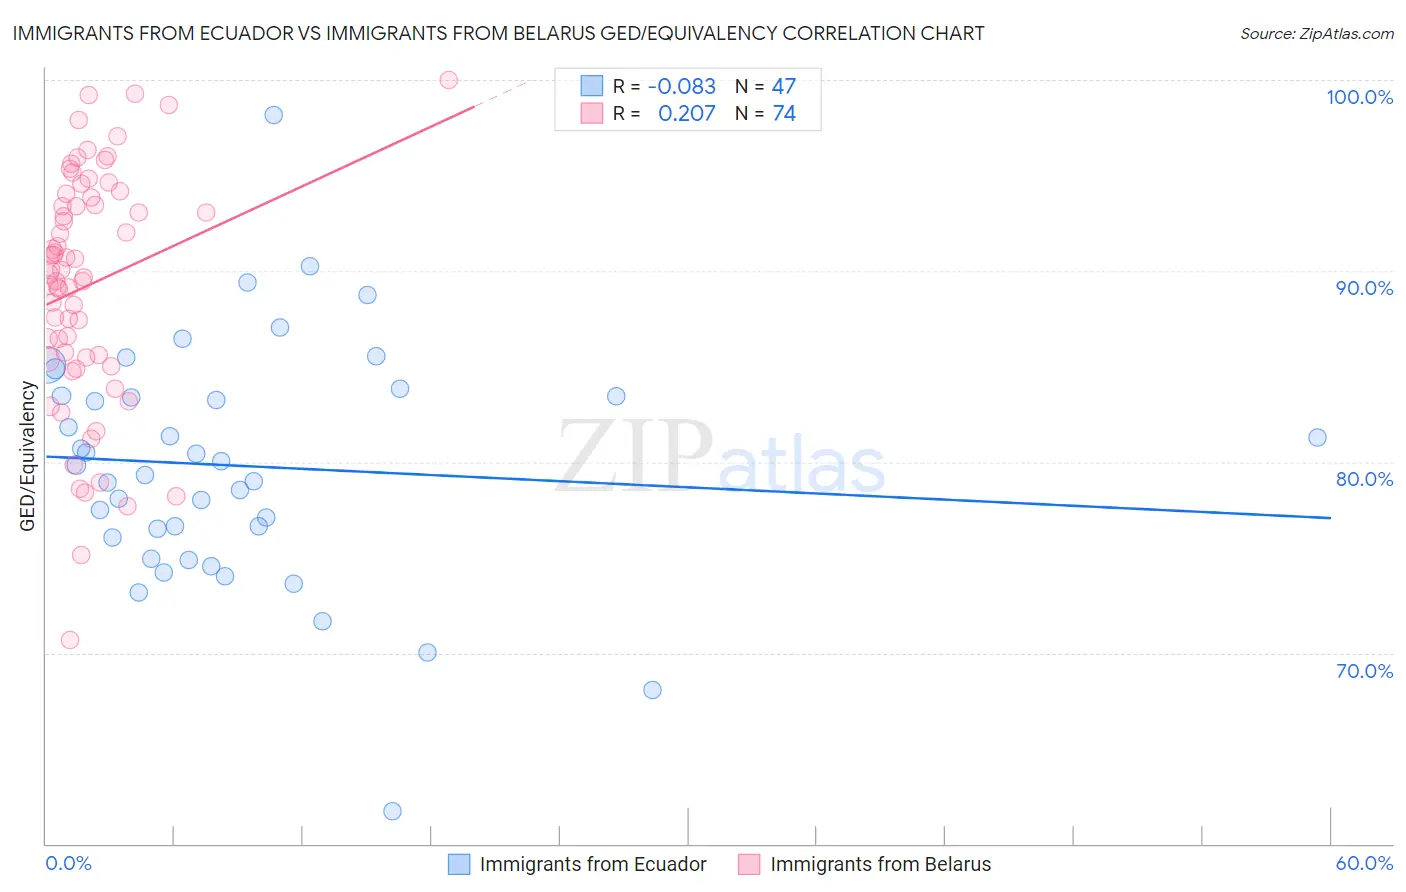
Immigrants from Ecuador vs Immigrants from Belarus GED/Equivalency Correlation Chart
The statistical analysis conducted on geographies consisting of 271,020,679 people shows a slight negative correlation between the proportion of Immigrants from Ecuador and percentage of population with at least ged/equivalency education in the United States with a correlation coefficient (R) of -0.083 and weighted average of 81.0%. Similarly, the statistical analysis conducted on geographies consisting of 150,205,158 people shows a weak positive correlation between the proportion of Immigrants from Belarus and percentage of population with at least ged/equivalency education in the United States with a correlation coefficient (R) of 0.207 and weighted average of 87.3%, a difference of 7.7%.
GED/Equivalency Correlation Summary
| Measurement | Immigrants from Ecuador | Immigrants from Belarus |
| Minimum | 61.7% | 70.7% |
| Maximum | 98.2% | 100.0% |
| Range | 36.5% | 29.3% |
| Mean | 79.8% | 89.2% |
| Median | 79.8% | 89.9% |
| Interquartile 25% (IQ1) | 76.0% | 85.4% |
| Interquartile 75% (IQ3) | 83.5% | 93.9% |
| Interquartile Range (IQR) | 7.5% | 8.4% |
| Standard Deviation (Sample) | 6.3% | 6.2% |
| Standard Deviation (Population) | 6.3% | 6.1% |
Similar Demographics by GED/Equivalency
Demographics Similar to Immigrants from Ecuador by GED/Equivalency
In terms of ged/equivalency, the demographic groups most similar to Immigrants from Ecuador are Immigrants from Guyana (81.0%, a difference of 0.060%), Native/Alaskan (80.9%, a difference of 0.070%), Puerto Rican (81.1%, a difference of 0.080%), Nicaraguan (80.9%, a difference of 0.10%), and Cape Verdean (80.9%, a difference of 0.10%).
| Demographics | Rating | Rank | GED/Equivalency |
| Immigrants | Haiti | 0.0 /100 | #302 | Tragic 81.6% |
| Immigrants | Portugal | 0.0 /100 | #303 | Tragic 81.6% |
| Navajo | 0.0 /100 | #304 | Tragic 81.5% |
| Immigrants | Grenada | 0.0 /100 | #305 | Tragic 81.3% |
| Guyanese | 0.0 /100 | #306 | Tragic 81.3% |
| Immigrants | Dominica | 0.0 /100 | #307 | Tragic 81.1% |
| Puerto Ricans | 0.0 /100 | #308 | Tragic 81.1% |
| Immigrants | Ecuador | 0.0 /100 | #309 | Tragic 81.0% |
| Immigrants | Guyana | 0.0 /100 | #310 | Tragic 81.0% |
| Natives/Alaskans | 0.0 /100 | #311 | Tragic 80.9% |
| Nicaraguans | 0.0 /100 | #312 | Tragic 80.9% |
| Cape Verdeans | 0.0 /100 | #313 | Tragic 80.9% |
| Belizeans | 0.0 /100 | #314 | Tragic 80.9% |
| Apache | 0.0 /100 | #315 | Tragic 80.7% |
| Central American Indians | 0.0 /100 | #316 | Tragic 80.6% |
Demographics Similar to Immigrants from Belarus by GED/Equivalency
In terms of ged/equivalency, the demographic groups most similar to Immigrants from Belarus are Immigrants from Croatia (87.3%, a difference of 0.010%), Palestinian (87.3%, a difference of 0.020%), Syrian (87.2%, a difference of 0.050%), Immigrants from Western Europe (87.3%, a difference of 0.070%), and Lebanese (87.2%, a difference of 0.11%).
| Demographics | Rating | Rank | GED/Equivalency |
| Israelis | 97.8 /100 | #92 | Exceptional 87.4% |
| Immigrants | North Macedonia | 97.8 /100 | #93 | Exceptional 87.4% |
| Immigrants | Russia | 97.8 /100 | #94 | Exceptional 87.4% |
| Immigrants | Greece | 97.7 /100 | #95 | Exceptional 87.4% |
| Czechoslovakians | 97.6 /100 | #96 | Exceptional 87.4% |
| Immigrants | Western Europe | 97.3 /100 | #97 | Exceptional 87.3% |
| Immigrants | Croatia | 96.9 /100 | #98 | Exceptional 87.3% |
| Immigrants | Belarus | 96.9 /100 | #99 | Exceptional 87.3% |
| Palestinians | 96.8 /100 | #100 | Exceptional 87.3% |
| Syrians | 96.6 /100 | #101 | Exceptional 87.2% |
| Lebanese | 96.2 /100 | #102 | Exceptional 87.2% |
| Jordanians | 96.1 /100 | #103 | Exceptional 87.2% |
| Immigrants | Hungary | 96.0 /100 | #104 | Exceptional 87.2% |
| Indians (Asian) | 95.9 /100 | #105 | Exceptional 87.1% |
| Immigrants | Zimbabwe | 95.8 /100 | #106 | Exceptional 87.1% |