Spanish vs Immigrants from Belarus GED/Equivalency
COMPARE
Spanish
Immigrants from Belarus
GED/Equivalency
GED/Equivalency Comparison
Spanish
Immigrants from Belarus
85.4%
GED/EQUIVALENCY
32.8/ 100
METRIC RATING
185th/ 347
METRIC RANK
87.3%
GED/EQUIVALENCY
96.9/ 100
METRIC RATING
99th/ 347
METRIC RANK
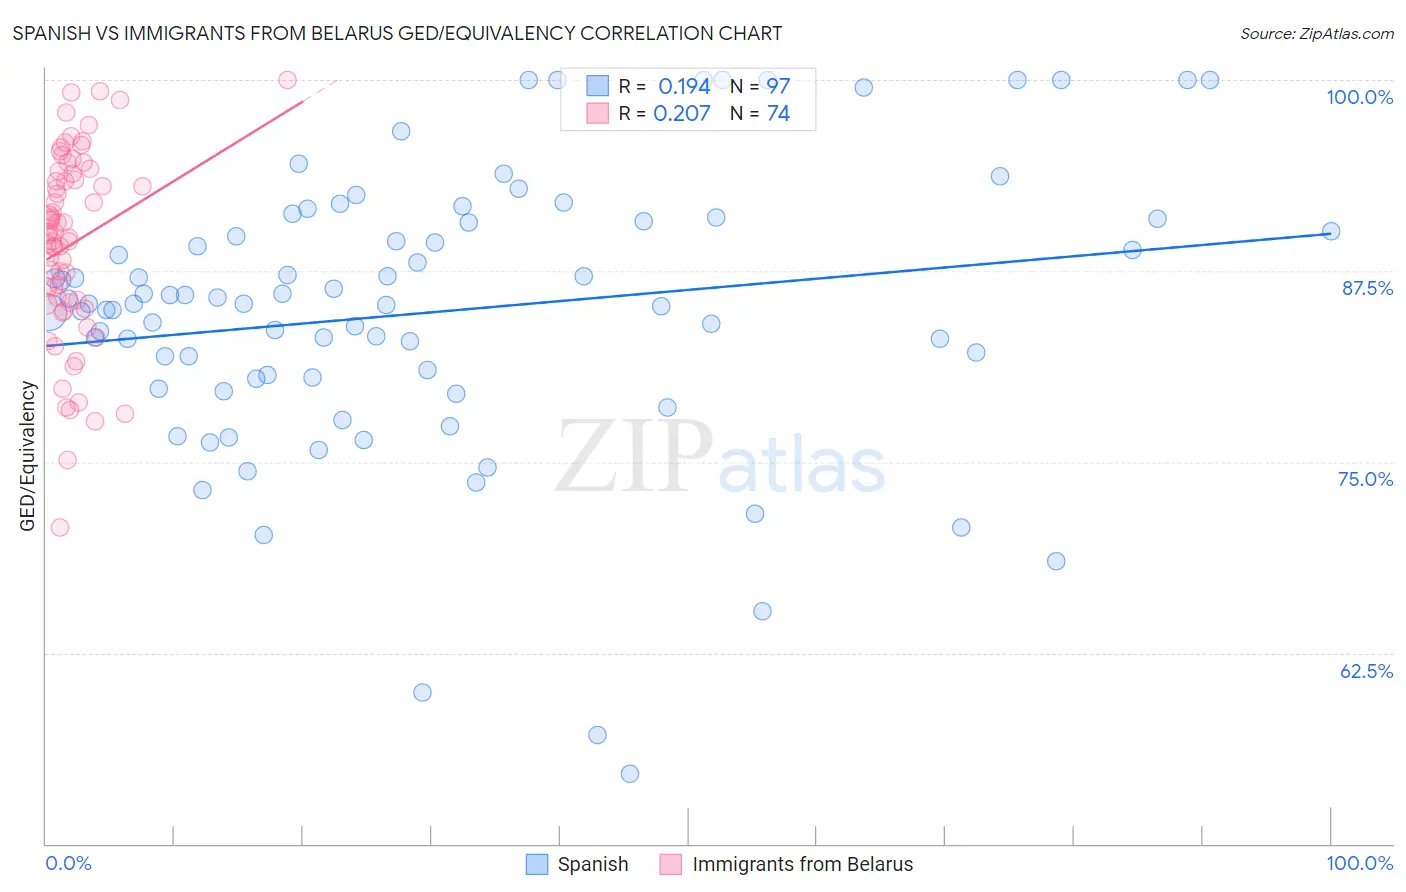
Spanish vs Immigrants from Belarus GED/Equivalency Correlation Chart
The statistical analysis conducted on geographies consisting of 422,188,828 people shows a poor positive correlation between the proportion of Spanish and percentage of population with at least ged/equivalency education in the United States with a correlation coefficient (R) of 0.194 and weighted average of 85.4%. Similarly, the statistical analysis conducted on geographies consisting of 150,205,158 people shows a weak positive correlation between the proportion of Immigrants from Belarus and percentage of population with at least ged/equivalency education in the United States with a correlation coefficient (R) of 0.207 and weighted average of 87.3%, a difference of 2.1%.
GED/Equivalency Correlation Summary
| Measurement | Spanish | Immigrants from Belarus |
| Minimum | 54.5% | 70.7% |
| Maximum | 100.0% | 100.0% |
| Range | 45.5% | 29.3% |
| Mean | 84.8% | 89.2% |
| Median | 85.4% | 89.9% |
| Interquartile 25% (IQ1) | 80.5% | 85.4% |
| Interquartile 75% (IQ3) | 90.7% | 93.9% |
| Interquartile Range (IQR) | 10.3% | 8.4% |
| Standard Deviation (Sample) | 9.2% | 6.2% |
| Standard Deviation (Population) | 9.1% | 6.1% |
Similar Demographics by GED/Equivalency
Demographics Similar to Spanish by GED/Equivalency
In terms of ged/equivalency, the demographic groups most similar to Spanish are Immigrants from Oceania (85.5%, a difference of 0.020%), Spaniard (85.4%, a difference of 0.020%), Immigrants from Sudan (85.5%, a difference of 0.030%), Sudanese (85.5%, a difference of 0.050%), and Immigrants from Afghanistan (85.4%, a difference of 0.070%).
| Demographics | Rating | Rank | GED/Equivalency |
| Koreans | 41.2 /100 | #178 | Average 85.6% |
| Aleuts | 40.5 /100 | #179 | Average 85.6% |
| Immigrants | Southern Europe | 38.4 /100 | #180 | Fair 85.5% |
| Moroccans | 37.7 /100 | #181 | Fair 85.5% |
| Sudanese | 35.2 /100 | #182 | Fair 85.5% |
| Immigrants | Sudan | 34.2 /100 | #183 | Fair 85.5% |
| Immigrants | Oceania | 33.6 /100 | #184 | Fair 85.5% |
| Spanish | 32.8 /100 | #185 | Fair 85.4% |
| Spaniards | 31.9 /100 | #186 | Fair 85.4% |
| Immigrants | Afghanistan | 29.8 /100 | #187 | Fair 85.4% |
| Immigrants | Sierra Leone | 29.0 /100 | #188 | Fair 85.4% |
| Guamanians/Chamorros | 28.4 /100 | #189 | Fair 85.3% |
| Alaskan Athabascans | 27.5 /100 | #190 | Fair 85.3% |
| South American Indians | 22.8 /100 | #191 | Fair 85.2% |
| Immigrants | Nonimmigrants | 22.7 /100 | #192 | Fair 85.2% |
Demographics Similar to Immigrants from Belarus by GED/Equivalency
In terms of ged/equivalency, the demographic groups most similar to Immigrants from Belarus are Immigrants from Croatia (87.3%, a difference of 0.010%), Palestinian (87.3%, a difference of 0.020%), Syrian (87.2%, a difference of 0.050%), Immigrants from Western Europe (87.3%, a difference of 0.070%), and Lebanese (87.2%, a difference of 0.11%).
| Demographics | Rating | Rank | GED/Equivalency |
| Israelis | 97.8 /100 | #92 | Exceptional 87.4% |
| Immigrants | North Macedonia | 97.8 /100 | #93 | Exceptional 87.4% |
| Immigrants | Russia | 97.8 /100 | #94 | Exceptional 87.4% |
| Immigrants | Greece | 97.7 /100 | #95 | Exceptional 87.4% |
| Czechoslovakians | 97.6 /100 | #96 | Exceptional 87.4% |
| Immigrants | Western Europe | 97.3 /100 | #97 | Exceptional 87.3% |
| Immigrants | Croatia | 96.9 /100 | #98 | Exceptional 87.3% |
| Immigrants | Belarus | 96.9 /100 | #99 | Exceptional 87.3% |
| Palestinians | 96.8 /100 | #100 | Exceptional 87.3% |
| Syrians | 96.6 /100 | #101 | Exceptional 87.2% |
| Lebanese | 96.2 /100 | #102 | Exceptional 87.2% |
| Jordanians | 96.1 /100 | #103 | Exceptional 87.2% |
| Immigrants | Hungary | 96.0 /100 | #104 | Exceptional 87.2% |
| Indians (Asian) | 95.9 /100 | #105 | Exceptional 87.1% |
| Immigrants | Zimbabwe | 95.8 /100 | #106 | Exceptional 87.1% |