Arab vs Immigrants from Belarus In Labor Force | Age 20-24
COMPARE
Arab
Immigrants from Belarus
In Labor Force | Age 20-24
In Labor Force | Age 20-24 Comparison
Arabs
Immigrants from Belarus
74.6%
IN LABOR FORCE | AGE 20-24
15.8/ 100
METRIC RATING
209th/ 347
METRIC RANK
73.0%
IN LABOR FORCE | AGE 20-24
0.1/ 100
METRIC RATING
290th/ 347
METRIC RANK
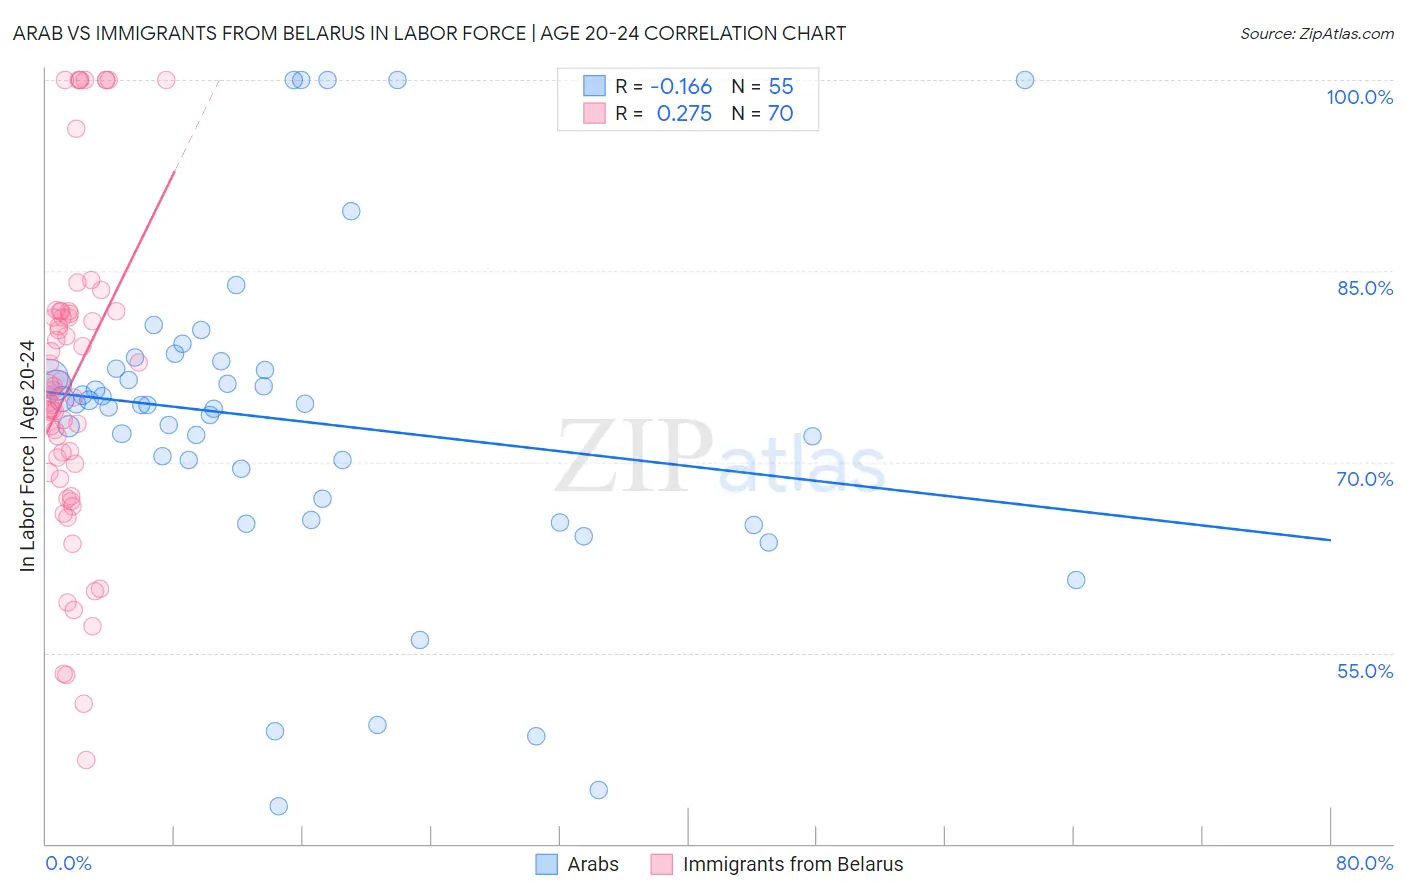
Arab vs Immigrants from Belarus In Labor Force | Age 20-24 Correlation Chart
The statistical analysis conducted on geographies consisting of 486,568,832 people shows a poor negative correlation between the proportion of Arabs and labor force participation rate among population between the ages 20 and 24 in the United States with a correlation coefficient (R) of -0.166 and weighted average of 74.6%. Similarly, the statistical analysis conducted on geographies consisting of 150,196,069 people shows a weak positive correlation between the proportion of Immigrants from Belarus and labor force participation rate among population between the ages 20 and 24 in the United States with a correlation coefficient (R) of 0.275 and weighted average of 73.0%, a difference of 2.2%.
In Labor Force | Age 20-24 Correlation Summary
| Measurement | Arab | Immigrants from Belarus |
| Minimum | 42.9% | 46.6% |
| Maximum | 100.0% | 100.0% |
| Range | 57.1% | 53.4% |
| Mean | 73.2% | 76.3% |
| Median | 74.5% | 75.4% |
| Interquartile 25% (IQ1) | 67.1% | 69.2% |
| Interquartile 75% (IQ3) | 77.3% | 81.8% |
| Interquartile Range (IQR) | 10.2% | 12.6% |
| Standard Deviation (Sample) | 12.8% | 12.7% |
| Standard Deviation (Population) | 12.7% | 12.6% |
Similar Demographics by In Labor Force | Age 20-24
Demographics Similar to Arabs by In Labor Force | Age 20-24
In terms of in labor force | age 20-24, the demographic groups most similar to Arabs are Immigrants from Uruguay (74.6%, a difference of 0.0%), Albanian (74.6%, a difference of 0.010%), Uruguayan (74.6%, a difference of 0.020%), Immigrants from Australia (74.6%, a difference of 0.030%), and Sioux (74.6%, a difference of 0.040%).
| Demographics | Rating | Rank | In Labor Force | Age 20-24 |
| Moroccans | 20.4 /100 | #202 | Fair 74.7% |
| Immigrants | Northern Africa | 17.9 /100 | #203 | Poor 74.6% |
| Immigrants | Italy | 17.6 /100 | #204 | Poor 74.6% |
| Inupiat | 17.6 /100 | #205 | Poor 74.6% |
| Sioux | 17.5 /100 | #206 | Poor 74.6% |
| Albanians | 16.2 /100 | #207 | Poor 74.6% |
| Immigrants | Uruguay | 15.8 /100 | #208 | Poor 74.6% |
| Arabs | 15.8 /100 | #209 | Poor 74.6% |
| Uruguayans | 15.1 /100 | #210 | Poor 74.6% |
| Immigrants | Australia | 14.7 /100 | #211 | Poor 74.6% |
| Creek | 13.3 /100 | #212 | Poor 74.5% |
| Peruvians | 13.3 /100 | #213 | Poor 74.5% |
| Immigrants | Southern Europe | 13.2 /100 | #214 | Poor 74.5% |
| Immigrants | Ghana | 12.7 /100 | #215 | Poor 74.5% |
| Immigrants | Kuwait | 12.7 /100 | #216 | Poor 74.5% |
Demographics Similar to Immigrants from Belarus by In Labor Force | Age 20-24
In terms of in labor force | age 20-24, the demographic groups most similar to Immigrants from Belarus are U.S. Virgin Islander (73.0%, a difference of 0.080%), Immigrants from Nicaragua (72.9%, a difference of 0.080%), Argentinean (73.1%, a difference of 0.11%), Pueblo (72.9%, a difference of 0.17%), and Immigrants from Korea (73.1%, a difference of 0.19%).
| Demographics | Rating | Rank | In Labor Force | Age 20-24 |
| Immigrants | Bahamas | 0.1 /100 | #283 | Tragic 73.2% |
| Kiowa | 0.1 /100 | #284 | Tragic 73.2% |
| Nicaraguans | 0.1 /100 | #285 | Tragic 73.2% |
| Immigrants | Lebanon | 0.1 /100 | #286 | Tragic 73.1% |
| Immigrants | Korea | 0.1 /100 | #287 | Tragic 73.1% |
| Argentineans | 0.1 /100 | #288 | Tragic 73.1% |
| U.S. Virgin Islanders | 0.1 /100 | #289 | Tragic 73.0% |
| Immigrants | Belarus | 0.1 /100 | #290 | Tragic 73.0% |
| Immigrants | Nicaragua | 0.0 /100 | #291 | Tragic 72.9% |
| Pueblo | 0.0 /100 | #292 | Tragic 72.9% |
| Immigrants | Belize | 0.0 /100 | #293 | Tragic 72.8% |
| Immigrants | Argentina | 0.0 /100 | #294 | Tragic 72.8% |
| Okinawans | 0.0 /100 | #295 | Tragic 72.7% |
| Jamaicans | 0.0 /100 | #296 | Tragic 72.7% |
| Central American Indians | 0.0 /100 | #297 | Tragic 72.7% |