Cajun vs Immigrants from Barbados High School Diploma
COMPARE
Cajun
Immigrants from Barbados
High School Diploma
High School Diploma Comparison
Cajuns
Immigrants from Barbados
87.3%
HIGH SCHOOL DIPLOMA
0.4/ 100
METRIC RATING
260th/ 347
METRIC RANK
86.4%
HIGH SCHOOL DIPLOMA
0.0/ 100
METRIC RATING
283rd/ 347
METRIC RANK
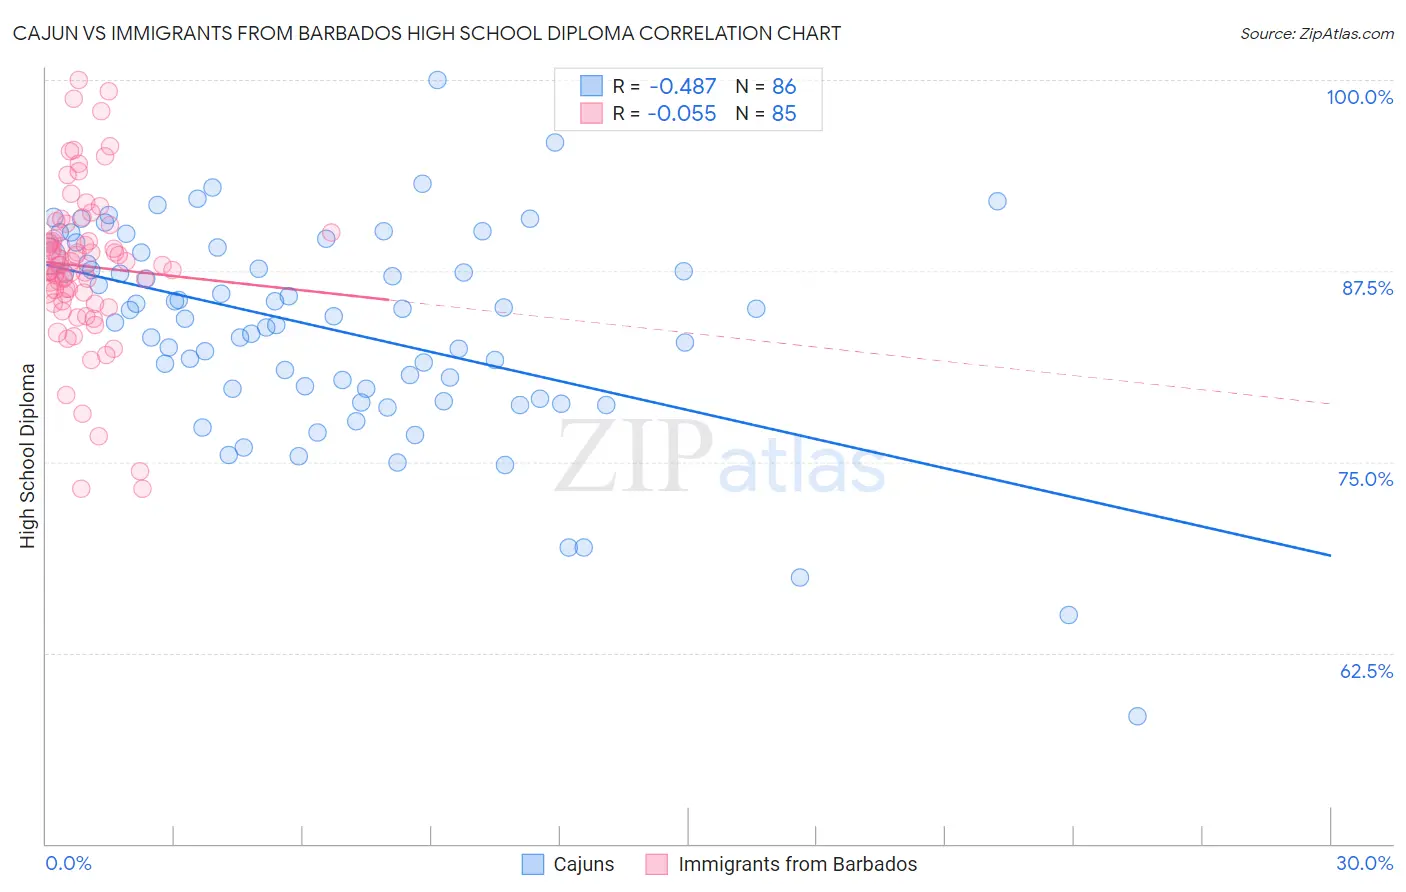
Cajun vs Immigrants from Barbados High School Diploma Correlation Chart
The statistical analysis conducted on geographies consisting of 149,713,149 people shows a moderate negative correlation between the proportion of Cajuns and percentage of population with at least high school diploma education in the United States with a correlation coefficient (R) of -0.487 and weighted average of 87.3%. Similarly, the statistical analysis conducted on geographies consisting of 112,782,130 people shows a slight negative correlation between the proportion of Immigrants from Barbados and percentage of population with at least high school diploma education in the United States with a correlation coefficient (R) of -0.055 and weighted average of 86.4%, a difference of 1.0%.
High School Diploma Correlation Summary
| Measurement | Cajun | Immigrants from Barbados |
| Minimum | 58.4% | 73.3% |
| Maximum | 100.0% | 100.0% |
| Range | 41.6% | 26.7% |
| Mean | 83.6% | 87.8% |
| Median | 84.5% | 87.9% |
| Interquartile 25% (IQ1) | 79.8% | 85.7% |
| Interquartile 75% (IQ3) | 88.4% | 89.8% |
| Interquartile Range (IQR) | 8.7% | 4.1% |
| Standard Deviation (Sample) | 6.9% | 5.1% |
| Standard Deviation (Population) | 6.8% | 5.0% |
Similar Demographics by High School Diploma
Demographics Similar to Cajuns by High School Diploma
In terms of high school diploma, the demographic groups most similar to Cajuns are Seminole (87.3%, a difference of 0.020%), Immigrants from Peru (87.3%, a difference of 0.050%), Immigrants from Ghana (87.4%, a difference of 0.080%), Immigrants from Western Africa (87.4%, a difference of 0.080%), and Immigrants from South Eastern Asia (87.2%, a difference of 0.080%).
| Demographics | Rating | Rank | High School Diploma |
| Immigrants | Uruguay | 1.0 /100 | #253 | Tragic 87.6% |
| Immigrants | Colombia | 1.0 /100 | #254 | Tragic 87.6% |
| Immigrants | Senegal | 0.9 /100 | #255 | Tragic 87.6% |
| Africans | 0.7 /100 | #256 | Tragic 87.5% |
| Bahamians | 0.7 /100 | #257 | Tragic 87.5% |
| Immigrants | Ghana | 0.5 /100 | #258 | Tragic 87.4% |
| Immigrants | Western Africa | 0.5 /100 | #259 | Tragic 87.4% |
| Cajuns | 0.4 /100 | #260 | Tragic 87.3% |
| Seminole | 0.4 /100 | #261 | Tragic 87.3% |
| Immigrants | Peru | 0.4 /100 | #262 | Tragic 87.3% |
| Immigrants | South Eastern Asia | 0.3 /100 | #263 | Tragic 87.2% |
| Jamaicans | 0.3 /100 | #264 | Tragic 87.2% |
| U.S. Virgin Islanders | 0.2 /100 | #265 | Tragic 87.1% |
| Immigrants | Congo | 0.2 /100 | #266 | Tragic 87.0% |
| Blacks/African Americans | 0.2 /100 | #267 | Tragic 87.0% |
Demographics Similar to Immigrants from Barbados by High School Diploma
In terms of high school diploma, the demographic groups most similar to Immigrants from Barbados are Paiute (86.4%, a difference of 0.050%), Dutch West Indian (86.5%, a difference of 0.060%), Indonesian (86.5%, a difference of 0.10%), Pueblo (86.5%, a difference of 0.15%), and Immigrants from Laos (86.6%, a difference of 0.17%).
| Demographics | Rating | Rank | High School Diploma |
| Immigrants | Burma/Myanmar | 0.1 /100 | #276 | Tragic 86.7% |
| Barbadians | 0.1 /100 | #277 | Tragic 86.7% |
| Hopi | 0.1 /100 | #278 | Tragic 86.6% |
| Immigrants | Laos | 0.0 /100 | #279 | Tragic 86.6% |
| Pueblo | 0.0 /100 | #280 | Tragic 86.5% |
| Indonesians | 0.0 /100 | #281 | Tragic 86.5% |
| Dutch West Indians | 0.0 /100 | #282 | Tragic 86.5% |
| Immigrants | Barbados | 0.0 /100 | #283 | Tragic 86.4% |
| Paiute | 0.0 /100 | #284 | Tragic 86.4% |
| Immigrants | West Indies | 0.0 /100 | #285 | Tragic 86.2% |
| Immigrants | St. Vincent and the Grenadines | 0.0 /100 | #286 | Tragic 86.2% |
| Ute | 0.0 /100 | #287 | Tragic 86.2% |
| Immigrants | Vietnam | 0.0 /100 | #288 | Tragic 86.2% |
| Yup'ik | 0.0 /100 | #289 | Tragic 86.1% |
| Fijians | 0.0 /100 | #290 | Tragic 86.0% |