American vs Immigrants from Latin America High School Diploma
COMPARE
American
Immigrants from Latin America
High School Diploma
High School Diploma Comparison
Americans
Immigrants from Latin America
89.1%
HIGH SCHOOL DIPLOMA
47.2/ 100
METRIC RATING
179th/ 347
METRIC RANK
82.1%
HIGH SCHOOL DIPLOMA
0.0/ 100
METRIC RATING
333rd/ 347
METRIC RANK
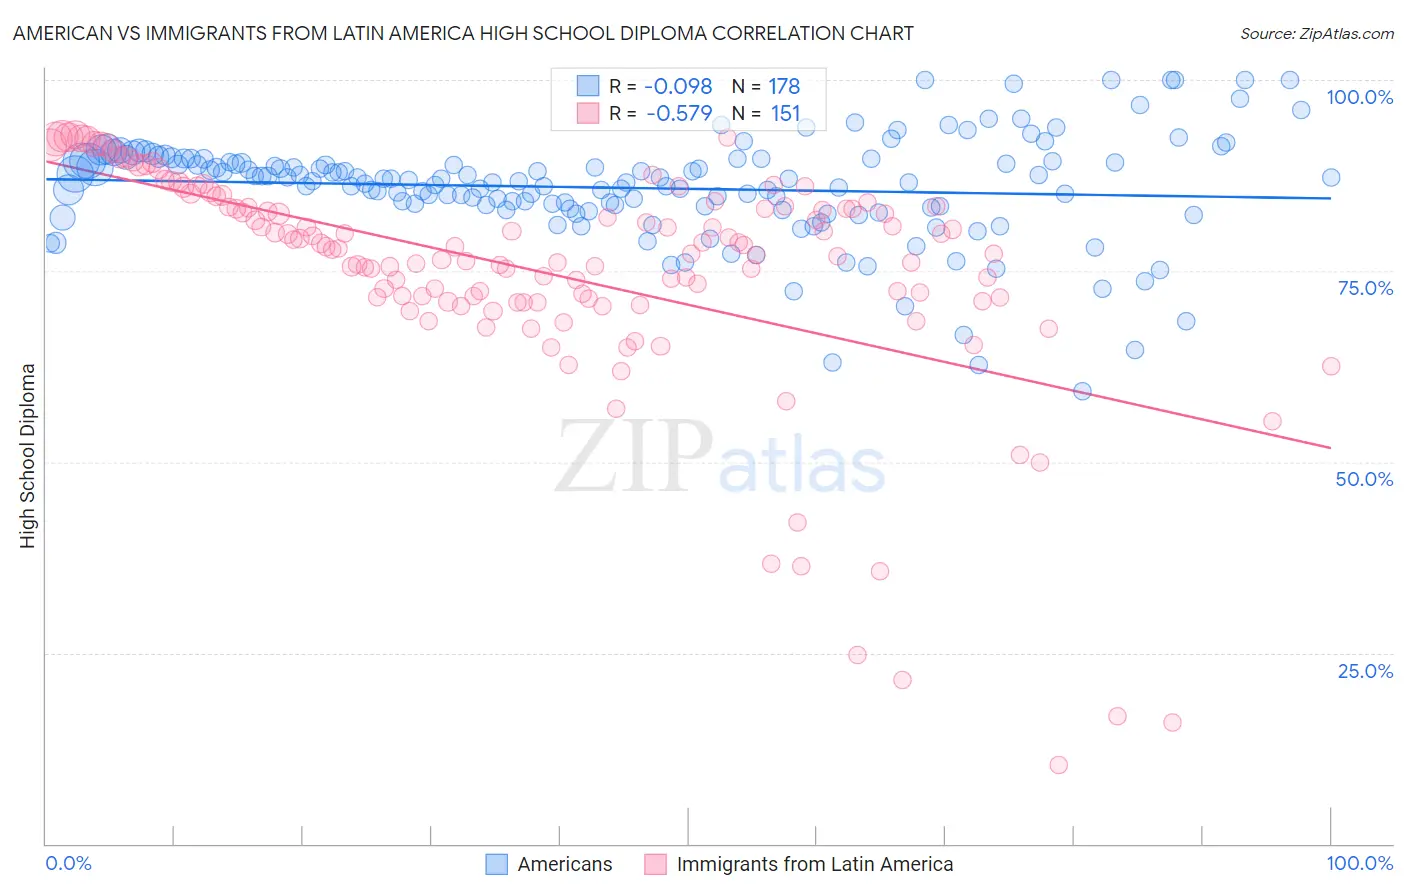
American vs Immigrants from Latin America High School Diploma Correlation Chart
The statistical analysis conducted on geographies consisting of 581,993,169 people shows a slight negative correlation between the proportion of Americans and percentage of population with at least high school diploma education in the United States with a correlation coefficient (R) of -0.098 and weighted average of 89.1%. Similarly, the statistical analysis conducted on geographies consisting of 558,650,507 people shows a substantial negative correlation between the proportion of Immigrants from Latin America and percentage of population with at least high school diploma education in the United States with a correlation coefficient (R) of -0.579 and weighted average of 82.1%, a difference of 8.5%.
High School Diploma Correlation Summary
| Measurement | American | Immigrants from Latin America |
| Minimum | 59.3% | 10.3% |
| Maximum | 100.0% | 92.8% |
| Range | 40.7% | 82.5% |
| Mean | 85.9% | 74.9% |
| Median | 86.8% | 77.8% |
| Interquartile 25% (IQ1) | 83.3% | 71.0% |
| Interquartile 75% (IQ3) | 89.4% | 83.4% |
| Interquartile Range (IQR) | 6.1% | 12.3% |
| Standard Deviation (Sample) | 6.9% | 15.1% |
| Standard Deviation (Population) | 6.9% | 15.0% |
Similar Demographics by High School Diploma
Demographics Similar to Americans by High School Diploma
In terms of high school diploma, the demographic groups most similar to Americans are Osage (89.1%, a difference of 0.020%), Sudanese (89.1%, a difference of 0.020%), Sierra Leonean (89.1%, a difference of 0.020%), Immigrants from Western Asia (89.1%, a difference of 0.030%), and Bolivian (89.1%, a difference of 0.030%).
| Demographics | Rating | Rank | High School Diploma |
| Immigrants | Nonimmigrants | 51.8 /100 | #172 | Average 89.2% |
| Immigrants | Indonesia | 50.3 /100 | #173 | Average 89.1% |
| Hmong | 50.0 /100 | #174 | Average 89.1% |
| Immigrants | Western Asia | 49.0 /100 | #175 | Average 89.1% |
| Osage | 48.9 /100 | #176 | Average 89.1% |
| Sudanese | 48.5 /100 | #177 | Average 89.1% |
| Sierra Leoneans | 48.4 /100 | #178 | Average 89.1% |
| Americans | 47.2 /100 | #179 | Average 89.1% |
| Bolivians | 45.2 /100 | #180 | Average 89.1% |
| Venezuelans | 43.6 /100 | #181 | Average 89.1% |
| Spaniards | 43.4 /100 | #182 | Average 89.1% |
| Potawatomi | 42.5 /100 | #183 | Average 89.0% |
| Immigrants | Syria | 39.2 /100 | #184 | Fair 89.0% |
| Ethiopians | 37.0 /100 | #185 | Fair 89.0% |
| Immigrants | Eastern Africa | 35.8 /100 | #186 | Fair 88.9% |
Demographics Similar to Immigrants from Latin America by High School Diploma
In terms of high school diploma, the demographic groups most similar to Immigrants from Latin America are Tohono O'odham (82.1%, a difference of 0.11%), Guatemalan (82.0%, a difference of 0.22%), Immigrants from Dominican Republic (82.0%, a difference of 0.23%), Immigrants from Yemen (81.8%, a difference of 0.37%), and Immigrants from Honduras (82.5%, a difference of 0.39%).
| Demographics | Rating | Rank | High School Diploma |
| Mexican American Indians | 0.0 /100 | #326 | Tragic 83.0% |
| Hondurans | 0.0 /100 | #327 | Tragic 83.0% |
| Dominicans | 0.0 /100 | #328 | Tragic 82.9% |
| Hispanics or Latinos | 0.0 /100 | #329 | Tragic 82.9% |
| Immigrants | Azores | 0.0 /100 | #330 | Tragic 82.8% |
| Central Americans | 0.0 /100 | #331 | Tragic 82.5% |
| Immigrants | Honduras | 0.0 /100 | #332 | Tragic 82.5% |
| Immigrants | Latin America | 0.0 /100 | #333 | Tragic 82.1% |
| Tohono O'odham | 0.0 /100 | #334 | Tragic 82.1% |
| Guatemalans | 0.0 /100 | #335 | Tragic 82.0% |
| Immigrants | Dominican Republic | 0.0 /100 | #336 | Tragic 82.0% |
| Immigrants | Yemen | 0.0 /100 | #337 | Tragic 81.8% |
| Salvadorans | 0.0 /100 | #338 | Tragic 81.7% |
| Pima | 0.0 /100 | #339 | Tragic 81.6% |
| Houma | 0.0 /100 | #340 | Tragic 81.5% |