American vs Kiowa High School Diploma
COMPARE
American
Kiowa
High School Diploma
High School Diploma Comparison
Americans
Kiowa
89.1%
HIGH SCHOOL DIPLOMA
47.2/ 100
METRIC RATING
179th/ 347
METRIC RANK
88.2%
HIGH SCHOOL DIPLOMA
5.3/ 100
METRIC RATING
228th/ 347
METRIC RANK
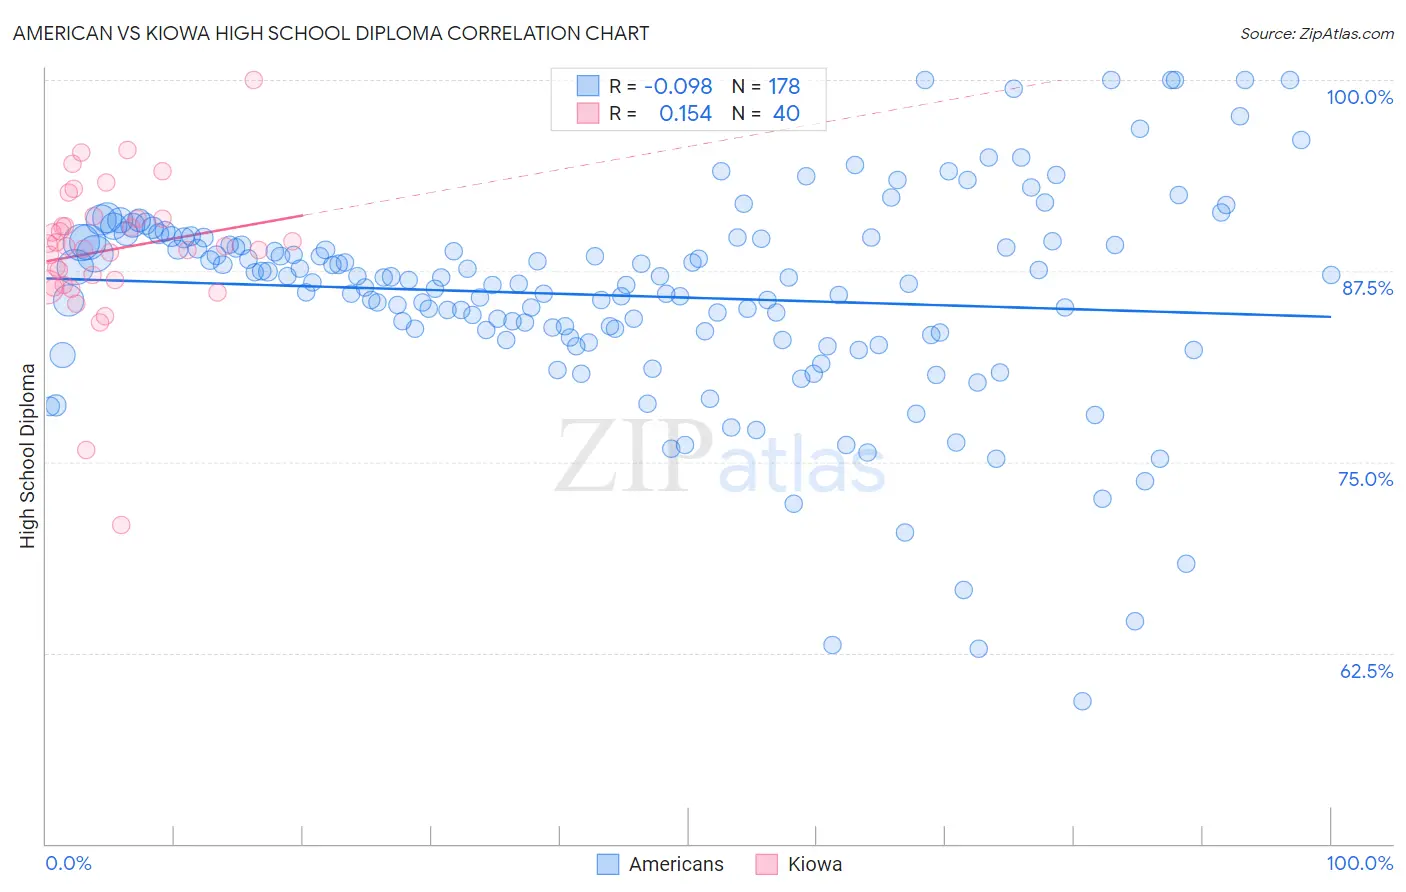
American vs Kiowa High School Diploma Correlation Chart
The statistical analysis conducted on geographies consisting of 581,993,169 people shows a slight negative correlation between the proportion of Americans and percentage of population with at least high school diploma education in the United States with a correlation coefficient (R) of -0.098 and weighted average of 89.1%. Similarly, the statistical analysis conducted on geographies consisting of 56,101,759 people shows a poor positive correlation between the proportion of Kiowa and percentage of population with at least high school diploma education in the United States with a correlation coefficient (R) of 0.154 and weighted average of 88.2%, a difference of 1.1%.
High School Diploma Correlation Summary
| Measurement | American | Kiowa |
| Minimum | 59.3% | 70.9% |
| Maximum | 100.0% | 100.0% |
| Range | 40.7% | 29.1% |
| Mean | 85.9% | 88.9% |
| Median | 86.8% | 89.1% |
| Interquartile 25% (IQ1) | 83.3% | 86.7% |
| Interquartile 75% (IQ3) | 89.4% | 90.9% |
| Interquartile Range (IQR) | 6.1% | 4.2% |
| Standard Deviation (Sample) | 6.9% | 4.9% |
| Standard Deviation (Population) | 6.9% | 4.8% |
Similar Demographics by High School Diploma
Demographics Similar to Americans by High School Diploma
In terms of high school diploma, the demographic groups most similar to Americans are Osage (89.1%, a difference of 0.020%), Sudanese (89.1%, a difference of 0.020%), Sierra Leonean (89.1%, a difference of 0.020%), Immigrants from Western Asia (89.1%, a difference of 0.030%), and Bolivian (89.1%, a difference of 0.030%).
| Demographics | Rating | Rank | High School Diploma |
| Immigrants | Nonimmigrants | 51.8 /100 | #172 | Average 89.2% |
| Immigrants | Indonesia | 50.3 /100 | #173 | Average 89.1% |
| Hmong | 50.0 /100 | #174 | Average 89.1% |
| Immigrants | Western Asia | 49.0 /100 | #175 | Average 89.1% |
| Osage | 48.9 /100 | #176 | Average 89.1% |
| Sudanese | 48.5 /100 | #177 | Average 89.1% |
| Sierra Leoneans | 48.4 /100 | #178 | Average 89.1% |
| Americans | 47.2 /100 | #179 | Average 89.1% |
| Bolivians | 45.2 /100 | #180 | Average 89.1% |
| Venezuelans | 43.6 /100 | #181 | Average 89.1% |
| Spaniards | 43.4 /100 | #182 | Average 89.1% |
| Potawatomi | 42.5 /100 | #183 | Average 89.0% |
| Immigrants | Syria | 39.2 /100 | #184 | Fair 89.0% |
| Ethiopians | 37.0 /100 | #185 | Fair 89.0% |
| Immigrants | Eastern Africa | 35.8 /100 | #186 | Fair 88.9% |
Demographics Similar to Kiowa by High School Diploma
In terms of high school diploma, the demographic groups most similar to Kiowa are Immigrants from Liberia (88.2%, a difference of 0.010%), Nigerian (88.2%, a difference of 0.010%), Uruguayan (88.2%, a difference of 0.020%), Blackfeet (88.1%, a difference of 0.090%), and Shoshone (88.3%, a difference of 0.11%).
| Demographics | Rating | Rank | High School Diploma |
| Immigrants | Afghanistan | 8.6 /100 | #221 | Tragic 88.3% |
| Colville | 7.8 /100 | #222 | Tragic 88.3% |
| Immigrants | Zaire | 7.6 /100 | #223 | Tragic 88.3% |
| Shoshone | 7.0 /100 | #224 | Tragic 88.3% |
| Creek | 6.9 /100 | #225 | Tragic 88.3% |
| Uruguayans | 5.6 /100 | #226 | Tragic 88.2% |
| Immigrants | Liberia | 5.5 /100 | #227 | Tragic 88.2% |
| Kiowa | 5.3 /100 | #228 | Tragic 88.2% |
| Nigerians | 5.2 /100 | #229 | Tragic 88.2% |
| Blackfeet | 4.2 /100 | #230 | Tragic 88.1% |
| Colombians | 3.8 /100 | #231 | Tragic 88.1% |
| Immigrants | Middle Africa | 3.4 /100 | #232 | Tragic 88.0% |
| Immigrants | Panama | 3.1 /100 | #233 | Tragic 88.0% |
| Immigrants | Thailand | 3.1 /100 | #234 | Tragic 88.0% |
| Immigrants | Bahamas | 2.9 /100 | #235 | Tragic 88.0% |