American vs Immigrants from Lebanon High School Diploma
COMPARE
American
Immigrants from Lebanon
High School Diploma
High School Diploma Comparison
Americans
Immigrants from Lebanon
89.1%
HIGH SCHOOL DIPLOMA
47.2/ 100
METRIC RATING
179th/ 347
METRIC RANK
89.5%
HIGH SCHOOL DIPLOMA
73.4/ 100
METRIC RATING
148th/ 347
METRIC RANK
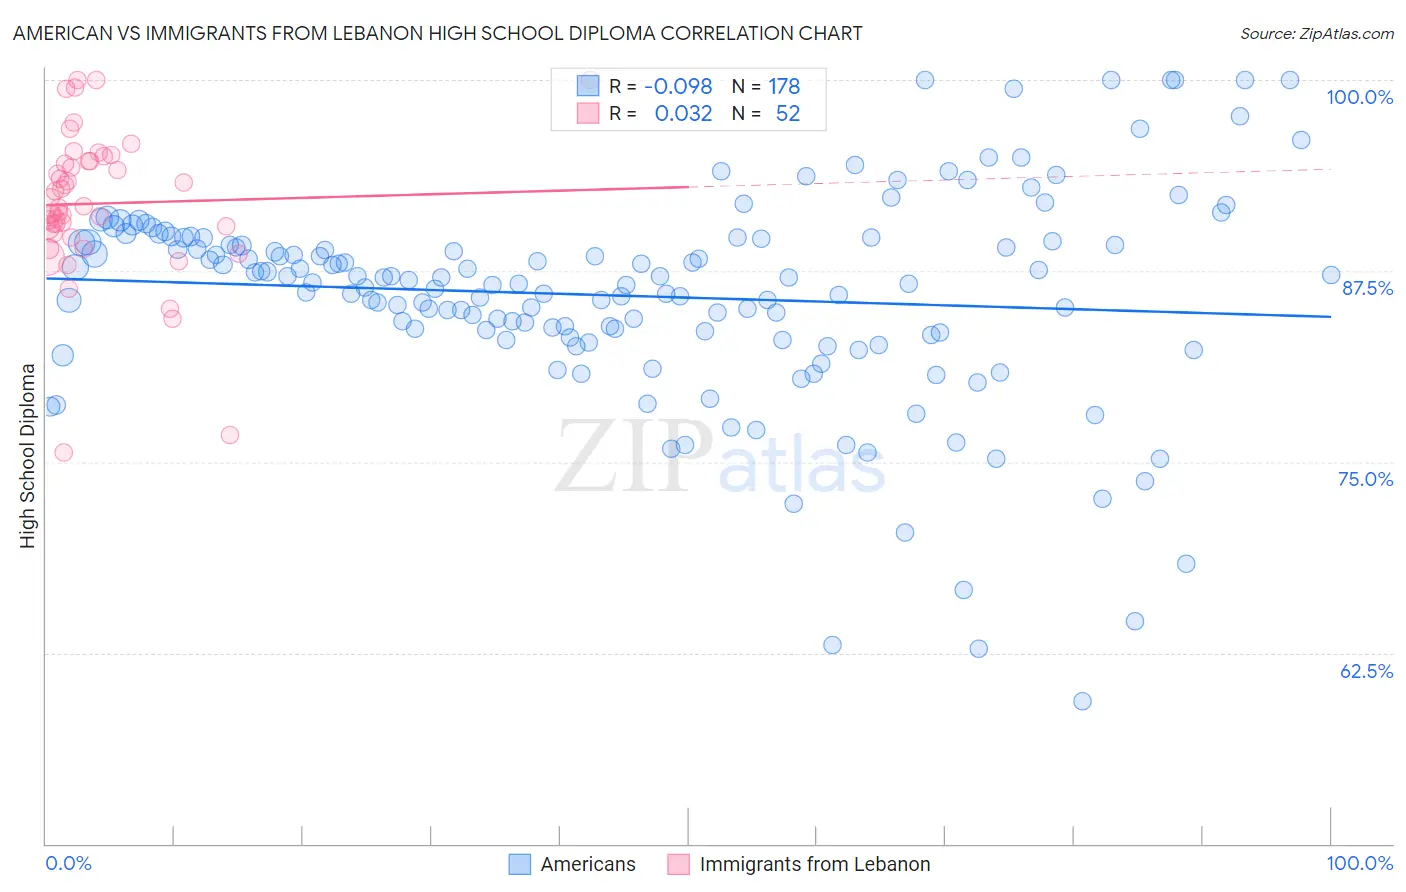
American vs Immigrants from Lebanon High School Diploma Correlation Chart
The statistical analysis conducted on geographies consisting of 581,993,169 people shows a slight negative correlation between the proportion of Americans and percentage of population with at least high school diploma education in the United States with a correlation coefficient (R) of -0.098 and weighted average of 89.1%. Similarly, the statistical analysis conducted on geographies consisting of 217,155,328 people shows no correlation between the proportion of Immigrants from Lebanon and percentage of population with at least high school diploma education in the United States with a correlation coefficient (R) of 0.032 and weighted average of 89.5%, a difference of 0.42%.
High School Diploma Correlation Summary
| Measurement | American | Immigrants from Lebanon |
| Minimum | 59.3% | 75.6% |
| Maximum | 100.0% | 100.0% |
| Range | 40.7% | 24.4% |
| Mean | 85.9% | 91.9% |
| Median | 86.8% | 91.7% |
| Interquartile 25% (IQ1) | 83.3% | 90.1% |
| Interquartile 75% (IQ3) | 89.4% | 94.7% |
| Interquartile Range (IQR) | 6.1% | 4.6% |
| Standard Deviation (Sample) | 6.9% | 4.8% |
| Standard Deviation (Population) | 6.9% | 4.8% |
Similar Demographics by High School Diploma
Demographics Similar to Americans by High School Diploma
In terms of high school diploma, the demographic groups most similar to Americans are Osage (89.1%, a difference of 0.020%), Sudanese (89.1%, a difference of 0.020%), Sierra Leonean (89.1%, a difference of 0.020%), Immigrants from Western Asia (89.1%, a difference of 0.030%), and Bolivian (89.1%, a difference of 0.030%).
| Demographics | Rating | Rank | High School Diploma |
| Immigrants | Nonimmigrants | 51.8 /100 | #172 | Average 89.2% |
| Immigrants | Indonesia | 50.3 /100 | #173 | Average 89.1% |
| Hmong | 50.0 /100 | #174 | Average 89.1% |
| Immigrants | Western Asia | 49.0 /100 | #175 | Average 89.1% |
| Osage | 48.9 /100 | #176 | Average 89.1% |
| Sudanese | 48.5 /100 | #177 | Average 89.1% |
| Sierra Leoneans | 48.4 /100 | #178 | Average 89.1% |
| Americans | 47.2 /100 | #179 | Average 89.1% |
| Bolivians | 45.2 /100 | #180 | Average 89.1% |
| Venezuelans | 43.6 /100 | #181 | Average 89.1% |
| Spaniards | 43.4 /100 | #182 | Average 89.1% |
| Potawatomi | 42.5 /100 | #183 | Average 89.0% |
| Immigrants | Syria | 39.2 /100 | #184 | Fair 89.0% |
| Ethiopians | 37.0 /100 | #185 | Fair 89.0% |
| Immigrants | Eastern Africa | 35.8 /100 | #186 | Fair 88.9% |
Demographics Similar to Immigrants from Lebanon by High School Diploma
In terms of high school diploma, the demographic groups most similar to Immigrants from Lebanon are Iraqi (89.5%, a difference of 0.010%), Immigrants from Poland (89.5%, a difference of 0.010%), Argentinean (89.5%, a difference of 0.020%), Paraguayan (89.5%, a difference of 0.040%), and Asian (89.4%, a difference of 0.050%).
| Demographics | Rating | Rank | High School Diploma |
| Chileans | 79.0 /100 | #141 | Good 89.6% |
| Indians (Asian) | 78.8 /100 | #142 | Good 89.6% |
| Pakistanis | 78.3 /100 | #143 | Good 89.6% |
| Immigrants | Kenya | 78.0 /100 | #144 | Good 89.6% |
| Immigrants | Brazil | 76.6 /100 | #145 | Good 89.5% |
| Immigrants | Spain | 76.2 /100 | #146 | Good 89.5% |
| Iraqis | 73.9 /100 | #147 | Good 89.5% |
| Immigrants | Lebanon | 73.4 /100 | #148 | Good 89.5% |
| Immigrants | Poland | 72.9 /100 | #149 | Good 89.5% |
| Argentineans | 72.3 /100 | #150 | Good 89.5% |
| Paraguayans | 71.4 /100 | #151 | Good 89.5% |
| Asians | 70.7 /100 | #152 | Good 89.4% |
| Immigrants | Iraq | 68.7 /100 | #153 | Good 89.4% |
| Alsatians | 66.8 /100 | #154 | Good 89.4% |
| Immigrants | Northern Africa | 66.4 /100 | #155 | Good 89.4% |