American vs Immigrants from Singapore High School Diploma
COMPARE
American
Immigrants from Singapore
High School Diploma
High School Diploma Comparison
Americans
Immigrants from Singapore
89.1%
HIGH SCHOOL DIPLOMA
47.2/ 100
METRIC RATING
179th/ 347
METRIC RANK
91.7%
HIGH SCHOOL DIPLOMA
99.9/ 100
METRIC RATING
17th/ 347
METRIC RANK
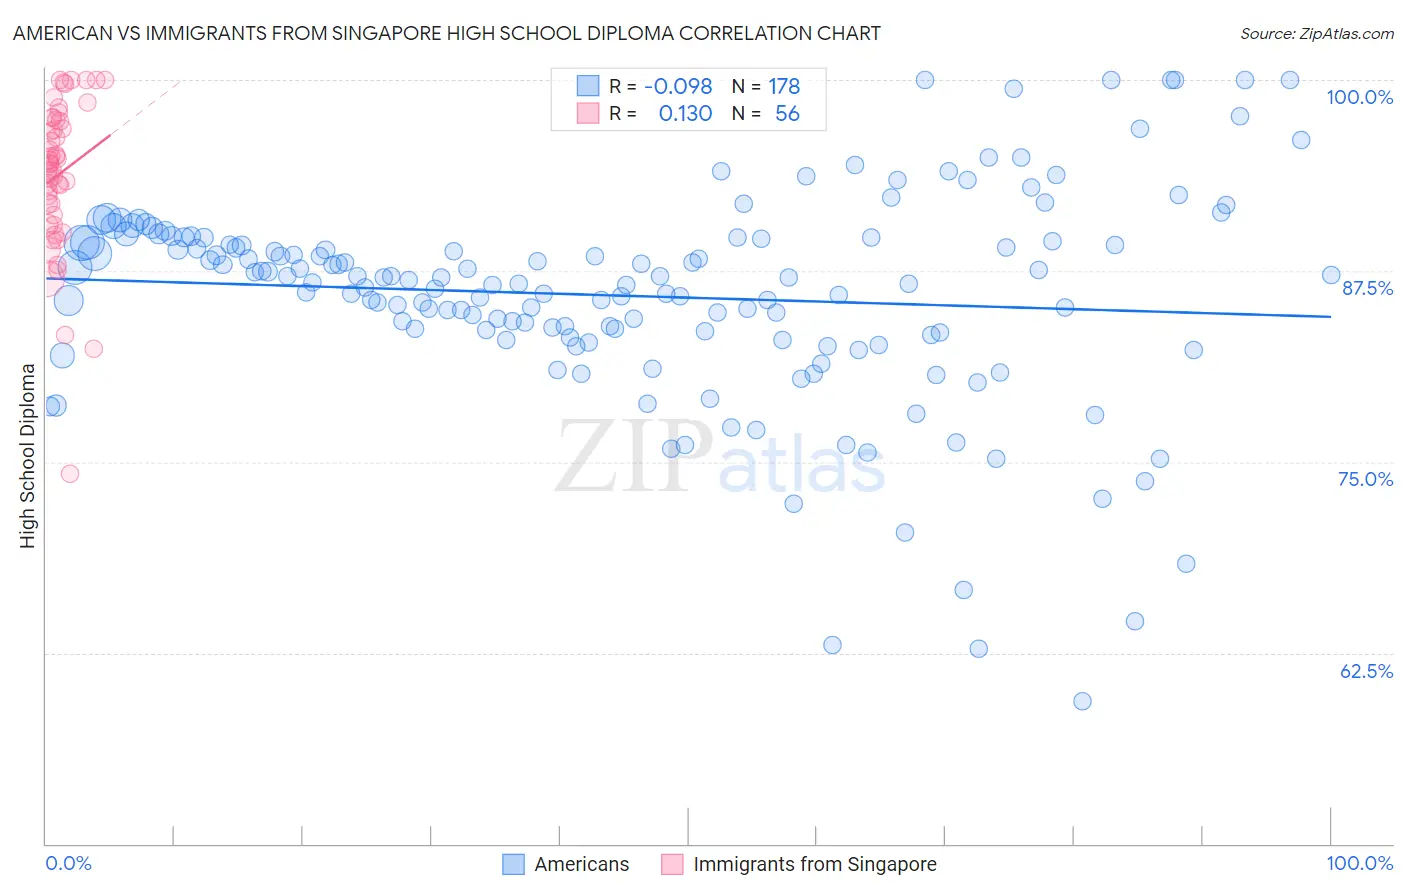
American vs Immigrants from Singapore High School Diploma Correlation Chart
The statistical analysis conducted on geographies consisting of 581,993,169 people shows a slight negative correlation between the proportion of Americans and percentage of population with at least high school diploma education in the United States with a correlation coefficient (R) of -0.098 and weighted average of 89.1%. Similarly, the statistical analysis conducted on geographies consisting of 137,521,094 people shows a poor positive correlation between the proportion of Immigrants from Singapore and percentage of population with at least high school diploma education in the United States with a correlation coefficient (R) of 0.130 and weighted average of 91.7%, a difference of 2.9%.
High School Diploma Correlation Summary
| Measurement | American | Immigrants from Singapore |
| Minimum | 59.3% | 74.3% |
| Maximum | 100.0% | 100.0% |
| Range | 40.7% | 25.7% |
| Mean | 85.9% | 93.8% |
| Median | 86.8% | 94.5% |
| Interquartile 25% (IQ1) | 83.3% | 91.5% |
| Interquartile 75% (IQ3) | 89.4% | 97.3% |
| Interquartile Range (IQR) | 6.1% | 5.8% |
| Standard Deviation (Sample) | 6.9% | 4.9% |
| Standard Deviation (Population) | 6.9% | 4.9% |
Similar Demographics by High School Diploma
Demographics Similar to Americans by High School Diploma
In terms of high school diploma, the demographic groups most similar to Americans are Osage (89.1%, a difference of 0.020%), Sudanese (89.1%, a difference of 0.020%), Sierra Leonean (89.1%, a difference of 0.020%), Immigrants from Western Asia (89.1%, a difference of 0.030%), and Bolivian (89.1%, a difference of 0.030%).
| Demographics | Rating | Rank | High School Diploma |
| Immigrants | Nonimmigrants | 51.8 /100 | #172 | Average 89.2% |
| Immigrants | Indonesia | 50.3 /100 | #173 | Average 89.1% |
| Hmong | 50.0 /100 | #174 | Average 89.1% |
| Immigrants | Western Asia | 49.0 /100 | #175 | Average 89.1% |
| Osage | 48.9 /100 | #176 | Average 89.1% |
| Sudanese | 48.5 /100 | #177 | Average 89.1% |
| Sierra Leoneans | 48.4 /100 | #178 | Average 89.1% |
| Americans | 47.2 /100 | #179 | Average 89.1% |
| Bolivians | 45.2 /100 | #180 | Average 89.1% |
| Venezuelans | 43.6 /100 | #181 | Average 89.1% |
| Spaniards | 43.4 /100 | #182 | Average 89.1% |
| Potawatomi | 42.5 /100 | #183 | Average 89.0% |
| Immigrants | Syria | 39.2 /100 | #184 | Fair 89.0% |
| Ethiopians | 37.0 /100 | #185 | Fair 89.0% |
| Immigrants | Eastern Africa | 35.8 /100 | #186 | Fair 88.9% |
Demographics Similar to Immigrants from Singapore by High School Diploma
In terms of high school diploma, the demographic groups most similar to Immigrants from Singapore are German (91.7%, a difference of 0.010%), Finnish (91.7%, a difference of 0.040%), Luxembourger (91.7%, a difference of 0.060%), Maltese (91.6%, a difference of 0.080%), and Bulgarian (91.8%, a difference of 0.090%).
| Demographics | Rating | Rank | High School Diploma |
| Croatians | 100.0 /100 | #10 | Exceptional 92.0% |
| Eastern Europeans | 100.0 /100 | #11 | Exceptional 91.9% |
| Poles | 100.0 /100 | #12 | Exceptional 91.9% |
| Danes | 100.0 /100 | #13 | Exceptional 91.8% |
| Bulgarians | 100.0 /100 | #14 | Exceptional 91.8% |
| Luxembourgers | 100.0 /100 | #15 | Exceptional 91.7% |
| Finns | 100.0 /100 | #16 | Exceptional 91.7% |
| Immigrants | Singapore | 99.9 /100 | #17 | Exceptional 91.7% |
| Germans | 99.9 /100 | #18 | Exceptional 91.7% |
| Maltese | 99.9 /100 | #19 | Exceptional 91.6% |
| Czechs | 99.9 /100 | #20 | Exceptional 91.6% |
| Filipinos | 99.9 /100 | #21 | Exceptional 91.6% |
| Estonians | 99.9 /100 | #22 | Exceptional 91.6% |
| Scandinavians | 99.9 /100 | #23 | Exceptional 91.5% |
| Italians | 99.9 /100 | #24 | Exceptional 91.5% |