American vs Hopi High School Diploma
COMPARE
American
Hopi
High School Diploma
High School Diploma Comparison
Americans
Hopi
89.1%
HIGH SCHOOL DIPLOMA
47.2/ 100
METRIC RATING
179th/ 347
METRIC RANK
86.6%
HIGH SCHOOL DIPLOMA
0.1/ 100
METRIC RATING
278th/ 347
METRIC RANK
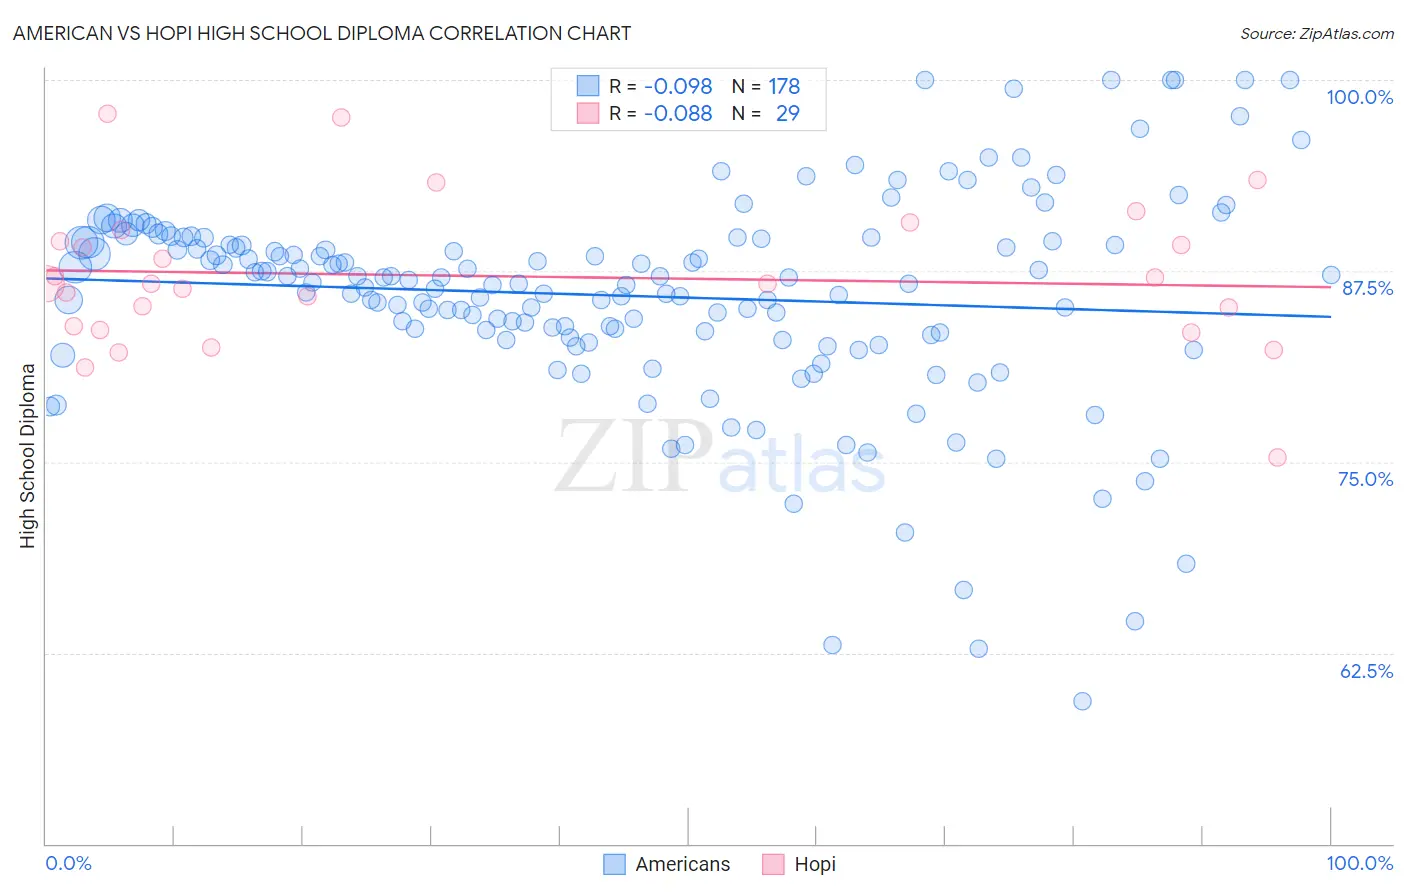
American vs Hopi High School Diploma Correlation Chart
The statistical analysis conducted on geographies consisting of 581,993,169 people shows a slight negative correlation between the proportion of Americans and percentage of population with at least high school diploma education in the United States with a correlation coefficient (R) of -0.098 and weighted average of 89.1%. Similarly, the statistical analysis conducted on geographies consisting of 74,739,957 people shows a slight negative correlation between the proportion of Hopi and percentage of population with at least high school diploma education in the United States with a correlation coefficient (R) of -0.088 and weighted average of 86.6%, a difference of 2.9%.
High School Diploma Correlation Summary
| Measurement | American | Hopi |
| Minimum | 59.3% | 75.3% |
| Maximum | 100.0% | 97.8% |
| Range | 40.7% | 22.5% |
| Mean | 85.9% | 87.2% |
| Median | 86.8% | 86.6% |
| Interquartile 25% (IQ1) | 83.3% | 83.8% |
| Interquartile 75% (IQ3) | 89.4% | 89.8% |
| Interquartile Range (IQR) | 6.1% | 6.1% |
| Standard Deviation (Sample) | 6.9% | 4.8% |
| Standard Deviation (Population) | 6.9% | 4.7% |
Similar Demographics by High School Diploma
Demographics Similar to Americans by High School Diploma
In terms of high school diploma, the demographic groups most similar to Americans are Osage (89.1%, a difference of 0.020%), Sudanese (89.1%, a difference of 0.020%), Sierra Leonean (89.1%, a difference of 0.020%), Immigrants from Western Asia (89.1%, a difference of 0.030%), and Bolivian (89.1%, a difference of 0.030%).
| Demographics | Rating | Rank | High School Diploma |
| Immigrants | Nonimmigrants | 51.8 /100 | #172 | Average 89.2% |
| Immigrants | Indonesia | 50.3 /100 | #173 | Average 89.1% |
| Hmong | 50.0 /100 | #174 | Average 89.1% |
| Immigrants | Western Asia | 49.0 /100 | #175 | Average 89.1% |
| Osage | 48.9 /100 | #176 | Average 89.1% |
| Sudanese | 48.5 /100 | #177 | Average 89.1% |
| Sierra Leoneans | 48.4 /100 | #178 | Average 89.1% |
| Americans | 47.2 /100 | #179 | Average 89.1% |
| Bolivians | 45.2 /100 | #180 | Average 89.1% |
| Venezuelans | 43.6 /100 | #181 | Average 89.1% |
| Spaniards | 43.4 /100 | #182 | Average 89.1% |
| Potawatomi | 42.5 /100 | #183 | Average 89.0% |
| Immigrants | Syria | 39.2 /100 | #184 | Fair 89.0% |
| Ethiopians | 37.0 /100 | #185 | Fair 89.0% |
| Immigrants | Eastern Africa | 35.8 /100 | #186 | Fair 88.9% |
Demographics Similar to Hopi by High School Diploma
In terms of high school diploma, the demographic groups most similar to Hopi are Immigrants from Laos (86.6%, a difference of 0.050%), Pueblo (86.5%, a difference of 0.060%), Immigrants from Burma/Myanmar (86.7%, a difference of 0.11%), Barbadian (86.7%, a difference of 0.11%), and Indonesian (86.5%, a difference of 0.11%).
| Demographics | Rating | Rank | High School Diploma |
| West Indians | 0.1 /100 | #271 | Tragic 86.9% |
| Trinidadians and Tobagonians | 0.1 /100 | #272 | Tragic 86.9% |
| Immigrants | Jamaica | 0.1 /100 | #273 | Tragic 86.9% |
| Bangladeshis | 0.1 /100 | #274 | Tragic 86.9% |
| Immigrants | Trinidad and Tobago | 0.1 /100 | #275 | Tragic 86.8% |
| Immigrants | Burma/Myanmar | 0.1 /100 | #276 | Tragic 86.7% |
| Barbadians | 0.1 /100 | #277 | Tragic 86.7% |
| Hopi | 0.1 /100 | #278 | Tragic 86.6% |
| Immigrants | Laos | 0.0 /100 | #279 | Tragic 86.6% |
| Pueblo | 0.0 /100 | #280 | Tragic 86.5% |
| Indonesians | 0.0 /100 | #281 | Tragic 86.5% |
| Dutch West Indians | 0.0 /100 | #282 | Tragic 86.5% |
| Immigrants | Barbados | 0.0 /100 | #283 | Tragic 86.4% |
| Paiute | 0.0 /100 | #284 | Tragic 86.4% |
| Immigrants | West Indies | 0.0 /100 | #285 | Tragic 86.2% |