American vs South American Indian High School Diploma
COMPARE
American
South American Indian
High School Diploma
High School Diploma Comparison
Americans
South American Indians
89.1%
HIGH SCHOOL DIPLOMA
47.2/ 100
METRIC RATING
179th/ 347
METRIC RANK
88.5%
HIGH SCHOOL DIPLOMA
12.2/ 100
METRIC RATING
212th/ 347
METRIC RANK
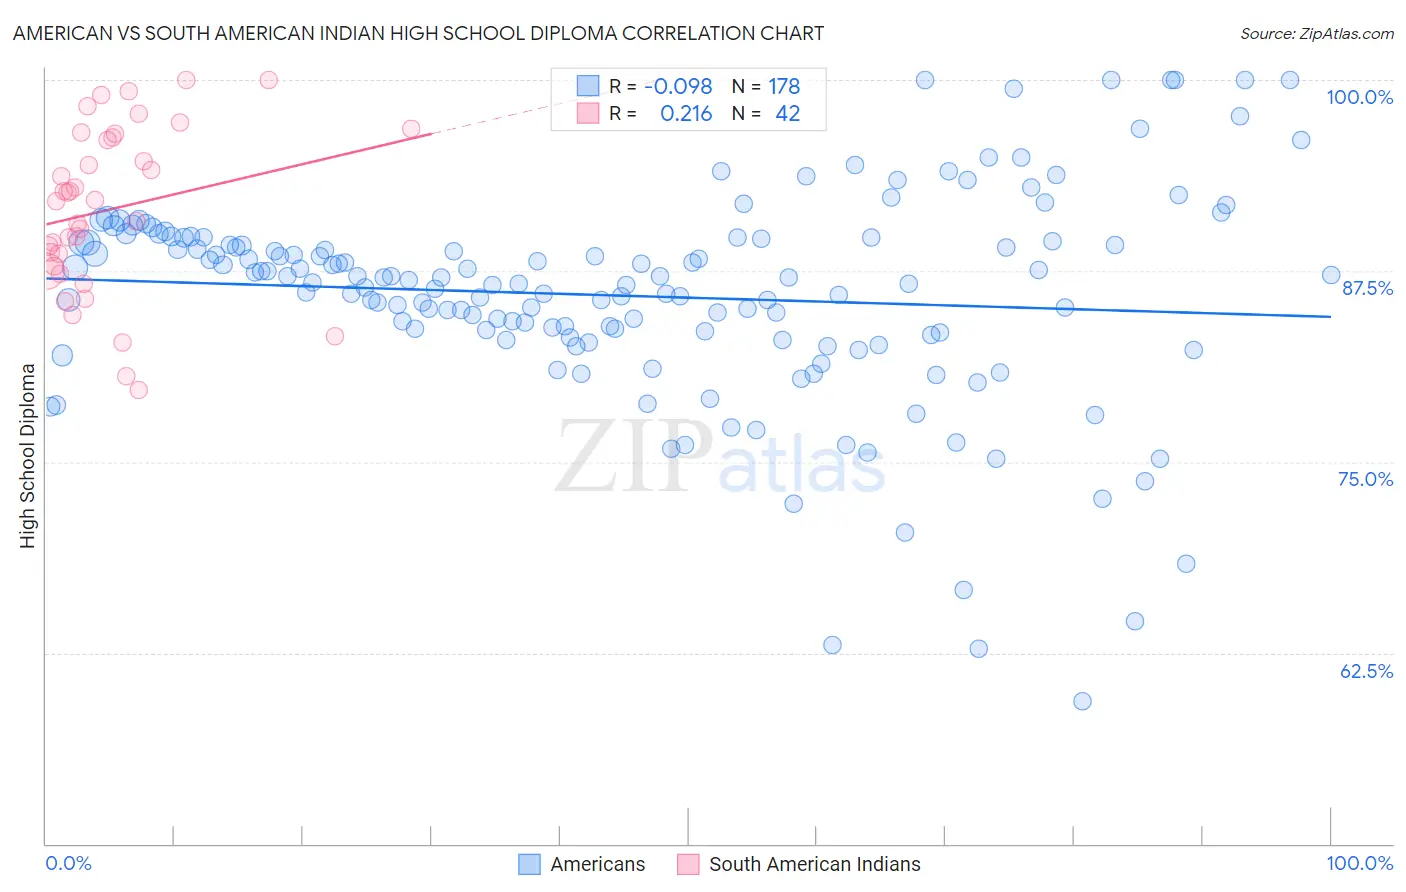
American vs South American Indian High School Diploma Correlation Chart
The statistical analysis conducted on geographies consisting of 581,993,169 people shows a slight negative correlation between the proportion of Americans and percentage of population with at least high school diploma education in the United States with a correlation coefficient (R) of -0.098 and weighted average of 89.1%. Similarly, the statistical analysis conducted on geographies consisting of 164,573,088 people shows a weak positive correlation between the proportion of South American Indians and percentage of population with at least high school diploma education in the United States with a correlation coefficient (R) of 0.216 and weighted average of 88.5%, a difference of 0.71%.
High School Diploma Correlation Summary
| Measurement | American | South American Indian |
| Minimum | 59.3% | 79.7% |
| Maximum | 100.0% | 100.0% |
| Range | 40.7% | 20.3% |
| Mean | 85.9% | 91.5% |
| Median | 86.8% | 92.1% |
| Interquartile 25% (IQ1) | 83.3% | 87.8% |
| Interquartile 75% (IQ3) | 89.4% | 96.3% |
| Interquartile Range (IQR) | 6.1% | 8.5% |
| Standard Deviation (Sample) | 6.9% | 5.3% |
| Standard Deviation (Population) | 6.9% | 5.3% |
Similar Demographics by High School Diploma
Demographics Similar to Americans by High School Diploma
In terms of high school diploma, the demographic groups most similar to Americans are Osage (89.1%, a difference of 0.020%), Sudanese (89.1%, a difference of 0.020%), Sierra Leonean (89.1%, a difference of 0.020%), Immigrants from Western Asia (89.1%, a difference of 0.030%), and Bolivian (89.1%, a difference of 0.030%).
| Demographics | Rating | Rank | High School Diploma |
| Immigrants | Nonimmigrants | 51.8 /100 | #172 | Average 89.2% |
| Immigrants | Indonesia | 50.3 /100 | #173 | Average 89.1% |
| Hmong | 50.0 /100 | #174 | Average 89.1% |
| Immigrants | Western Asia | 49.0 /100 | #175 | Average 89.1% |
| Osage | 48.9 /100 | #176 | Average 89.1% |
| Sudanese | 48.5 /100 | #177 | Average 89.1% |
| Sierra Leoneans | 48.4 /100 | #178 | Average 89.1% |
| Americans | 47.2 /100 | #179 | Average 89.1% |
| Bolivians | 45.2 /100 | #180 | Average 89.1% |
| Venezuelans | 43.6 /100 | #181 | Average 89.1% |
| Spaniards | 43.4 /100 | #182 | Average 89.1% |
| Potawatomi | 42.5 /100 | #183 | Average 89.0% |
| Immigrants | Syria | 39.2 /100 | #184 | Fair 89.0% |
| Ethiopians | 37.0 /100 | #185 | Fair 89.0% |
| Immigrants | Eastern Africa | 35.8 /100 | #186 | Fair 88.9% |
Demographics Similar to South American Indians by High School Diploma
In terms of high school diploma, the demographic groups most similar to South American Indians are Inupiat (88.5%, a difference of 0.030%), Immigrants from Somalia (88.4%, a difference of 0.040%), Immigrants from Cameroon (88.4%, a difference of 0.050%), Crow (88.4%, a difference of 0.050%), and Samoan (88.5%, a difference of 0.060%).
| Demographics | Rating | Rank | High School Diploma |
| Immigrants | Micronesia | 16.4 /100 | #205 | Poor 88.6% |
| Arapaho | 16.1 /100 | #206 | Poor 88.6% |
| Immigrants | Sierra Leone | 15.8 /100 | #207 | Poor 88.6% |
| Portuguese | 14.4 /100 | #208 | Poor 88.5% |
| Cherokee | 14.3 /100 | #209 | Poor 88.5% |
| Samoans | 14.0 /100 | #210 | Poor 88.5% |
| Inupiat | 13.1 /100 | #211 | Poor 88.5% |
| South American Indians | 12.2 /100 | #212 | Poor 88.5% |
| Immigrants | Somalia | 11.3 /100 | #213 | Poor 88.4% |
| Immigrants | Cameroon | 10.9 /100 | #214 | Poor 88.4% |
| Crow | 10.9 /100 | #215 | Poor 88.4% |
| Chickasaw | 10.7 /100 | #216 | Poor 88.4% |
| Immigrants | Africa | 10.6 /100 | #217 | Poor 88.4% |
| Immigrants | Bolivia | 10.3 /100 | #218 | Poor 88.4% |
| Costa Ricans | 9.6 /100 | #219 | Tragic 88.4% |