Alaska Native vs Immigrants from Ecuador Master's Degree

COMPARE

Alaska Native
Race
Ancestry
AfghanAfricanAlaska NativeAlaskan AthabascanAlbanianAleutAlsatianAmericanApacheArabArapahoArgentineanArmenianAssyrian/Chaldean/SyriacAustralianAustrianBahamianBangladeshiBarbadianBasqueBelgianBelizeanBermudanBhutaneseBlackfeetBolivianBrazilianBritishBritish West IndianBulgarianBurmeseCajunCambodianCanadianCape VerdeanCarpatho RusynCelticCentral AmericanCentral American IndianCherokeeCheyenneChickasawChileanChineseChippewaChoctawColombianColvilleComancheCosta RicanCreeCreekCroatianCrowCubanCypriotCzechCzechoslovakianDanishDelawareDominicanDutchDutch West IndianEastern EuropeanEcuadorianEgyptianEnglishEstonianEthiopianEuropeanFijianFilipinoFinnishFrenchFrench American IndianFrench CanadianGermanGerman RussianGhanaianGreekGuamanian/ChamorroGuatemalanGuyaneseHaitianHmongHonduranHopiHoumaHungarianIcelanderIndian (Asian)IndonesianInupiatIranianIraqiIrishIroquoisIsraeliItalianJamaicanJapaneseJordanianKenyanKiowaKoreanLaotianLatvianLebaneseLiberianLithuanianLumbeeLuxembourgerMacedonianMalaysianMalteseMarshalleseMenomineeMexicanMexican American IndianMongolianMoroccanNative HawaiianNavajoNepaleseNew ZealanderNicaraguanNigerianNorthern EuropeanNorwegianOkinawanOsageOttawaPaiutePakistaniPalestinianPanamanianParaguayanPennsylvania GermanPeruvianPimaPolishPortuguesePotawatomiPuebloPuerto RicanPuget Sound SalishRomanianRussianSalvadoranSamoanScandinavianScotch-IrishScottishSeminoleSenegaleseSerbianShoshoneSierra LeoneanSiouxSlavicSlovakSloveneSomaliSouth AfricanSouth AmericanSouth American IndianSoviet UnionSpaniardSpanishSpanish AmericanSpanish American IndianSri LankanSubsaharan AfricanSudaneseSwedishSwissSyrianTaiwaneseThaiTlingit-HaidaTohono O'OdhamTonganTrinidadian and TobagonianTsimshianTurkishU.S. Virgin IslanderUgandanUkrainianUruguayanUteVenezuelanVietnameseWelshWest IndianYakamaYaquiYugoslavianYumanYup'ikZimbabwean
Immigration
NonimmigrantsImmigrantsAfghanistanAfricaAlbaniaArgentinaArmeniaAsiaAustraliaAustriaBahamasBangladeshBarbadosBelarusBelgiumBelizeBoliviaBosnia and HerzegovinaBrazilBulgariaBurma/MyanmarCabo VerdeCambodiaCameroonCanadaCaribbeanCentral AmericaChileChinaColombiaCongoCosta RicaCroatiaCubaCzechoslovakiaDenmarkDominicaDominican RepublicEastern AfricaEastern AsiaEastern EuropeEgyptEl SalvadorEnglandEritreaEthiopiaEuropeFijiFranceGermanyGhanaGreeceGrenadaGuatemalaGuyanaHaitiHondurasHong KongHungaryIndiaIndonesiaIranIraqIrelandIsraelItalyJamaicaJapanJordanKazakhstanKenyaKoreaKuwaitLaosLatin AmericaLatviaLebanonLiberiaLithuaniaMalaysiaMexicoMicronesiaMiddle AfricaMoldovaMoroccoNepalNetherlandsNicaraguaNigeriaNorth AmericaNorth MacedoniaNorthern AfricaNorthern EuropeNorwayOceaniaPakistanPanamaPeruPhilippinesPolandPortugalRomaniaRussiaSaudi ArabiaScotlandSenegalSerbiaSierra LeoneSingaporeSomaliaSouth AfricaSouth AmericaSouth Central AsiaSouth Eastern AsiaSouthern EuropeSpainSri LankaSt. Vincent and the GrenadinesSudanSwedenSwitzerlandSyriaTaiwanThailandTrinidad and TobagoTurkeyUgandaUkraineUruguayUzbekistanVenezuelaVietnamWest IndiesWestern AfricaWestern AsiaWestern EuropeYemenZaireZimbabweAzores
Immigrants from Ecuador
Race
Ancestry
AfghanAfricanAlaskan AthabascanAlbanianAleutAlsatianAmericanApacheArabArapahoArgentineanArmenianAssyrian/Chaldean/SyriacAustralianAustrianBahamianBangladeshiBarbadianBasqueBelgianBelizeanBermudanBhutaneseBlackfeetBolivianBrazilianBritishBritish West IndianBulgarianBurmeseCajunCambodianCanadianCape VerdeanCarpatho RusynCelticCentral AmericanCentral American IndianCherokeeCheyenneChickasawChileanChineseChippewaChoctawColombianColvilleComancheCosta RicanCreeCreekCroatianCrowCubanCypriotCzechCzechoslovakianDanishDelawareDominicanDutchDutch West IndianEastern EuropeanEcuadorianEgyptianEnglishEstonianEthiopianEuropeanFijianFilipinoFinnishFrenchFrench American IndianFrench CanadianGermanGerman RussianGhanaianGreekGuamanian/ChamorroGuatemalanGuyaneseHaitianHmongHonduranHopiHoumaHungarianIcelanderIndian (Asian)IndonesianInupiatIranianIraqiIrishIroquoisIsraeliItalianJamaicanJapaneseJordanianKenyanKiowaKoreanLaotianLatvianLebaneseLiberianLithuanianLumbeeLuxembourgerMacedonianMalaysianMalteseMarshalleseMenomineeMexicanMexican American IndianMongolianMoroccanNative HawaiianNavajoNepaleseNew ZealanderNicaraguanNigerianNorthern EuropeanNorwegianOkinawanOsageOttawaPaiutePakistaniPalestinianPanamanianParaguayanPennsylvania GermanPeruvianPimaPolishPortuguesePotawatomiPuebloPuerto RicanPuget Sound SalishRomanianRussianSalvadoranSamoanScandinavianScotch-IrishScottishSeminoleSenegaleseSerbianShoshoneSierra LeoneanSiouxSlavicSlovakSloveneSomaliSouth AfricanSouth AmericanSouth American IndianSoviet UnionSpaniardSpanishSpanish AmericanSpanish American IndianSri LankanSubsaharan AfricanSudaneseSwedishSwissSyrianTaiwaneseThaiTlingit-HaidaTohono O'OdhamTonganTrinidadian and TobagonianTsimshianTurkishU.S. Virgin IslanderUgandanUkrainianUruguayanUteVenezuelanVietnameseWelshWest IndianYakamaYaquiYugoslavianYumanYup'ikZimbabwean
Immigration
NonimmigrantsImmigrantsAfghanistanAfricaAlbaniaArgentinaArmeniaAsiaAustraliaAustriaBahamasBangladeshBarbadosBelarusBelgiumBelizeBoliviaBosnia and HerzegovinaBrazilBulgariaBurma/MyanmarCabo VerdeCambodiaCameroonCanadaCaribbeanCentral AmericaChileChinaColombiaCongoCosta RicaCroatiaCubaCzechoslovakiaDenmarkDominicaDominican RepublicEastern AfricaEastern AsiaEastern EuropeEcuadorEgyptEl SalvadorEnglandEritreaEthiopiaEuropeFijiFranceGermanyGhanaGreeceGrenadaGuatemalaGuyanaHaitiHondurasHong KongHungaryIndiaIndonesiaIranIraqIrelandIsraelItalyJamaicaJapanJordanKazakhstanKenyaKoreaKuwaitLaosLatin AmericaLatviaLebanonLiberiaLithuaniaMalaysiaMexicoMicronesiaMiddle AfricaMoldovaMoroccoNepalNetherlandsNicaraguaNigeriaNorth AmericaNorth MacedoniaNorthern AfricaNorthern EuropeNorwayOceaniaPakistanPanamaPeruPhilippinesPolandPortugalRomaniaRussiaSaudi ArabiaScotlandSenegalSerbiaSierra LeoneSingaporeSomaliaSouth AfricaSouth AmericaSouth Central AsiaSouth Eastern AsiaSouthern EuropeSpainSri LankaSt. Vincent and the GrenadinesSudanSwedenSwitzerlandSyriaTaiwanThailandTrinidad and TobagoTurkeyUgandaUkraineUruguayUzbekistanVenezuelaVietnamWest IndiesWestern AfricaWestern AsiaWestern EuropeYemenZaireZimbabweAzores
Master's Degree
Income
Poverty
Unemployment
Labor Participation
Family Structure
Vehicle Availability
Education Level
Disability

Master's Degree Comparison

Alaska Natives

Immigrants from Ecuador

Tragic
Tragic
11.6%
MASTER'S DEGREE
0.1/ 100
METRIC RATING
293rd/ 347
METRIC RANK
13.6%
MASTER'S DEGREE
5.7/ 100
METRIC RATING
233rd/ 347
METRIC RANK

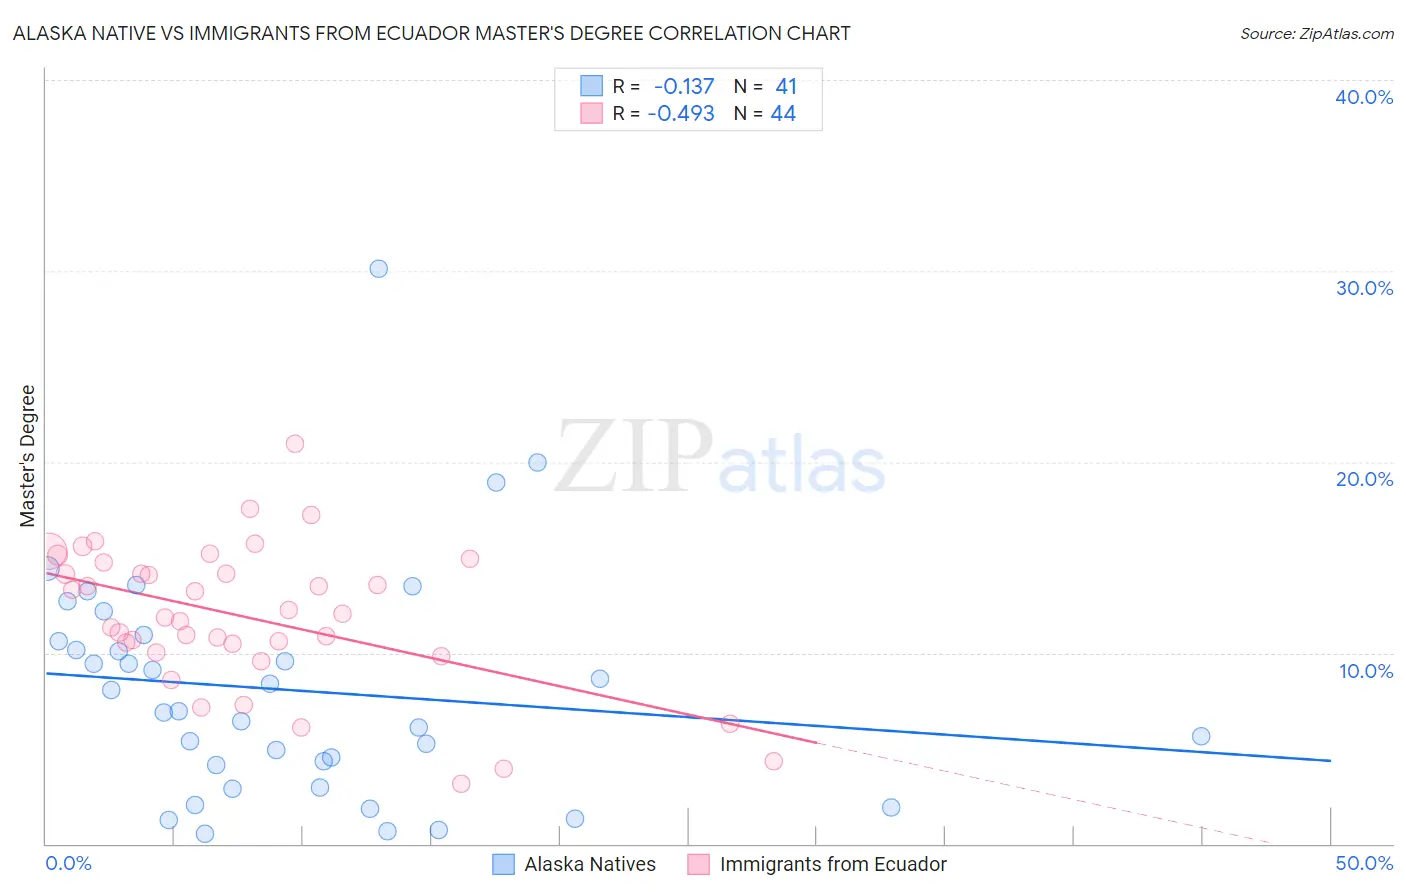
Alaska Native vs Immigrants from Ecuador Master's Degree Correlation Chart

The statistical analysis conducted on geographies consisting of 76,746,522 people shows a poor negative correlation between the proportion of Alaska Natives and percentage of population with at least master's degree education in the United States with a correlation coefficient (R) of -0.137 and weighted average of 11.6%. Similarly, the statistical analysis conducted on geographies consisting of 270,930,295 people shows a moderate negative correlation between the proportion of Immigrants from Ecuador and percentage of population with at least master's degree education in the United States with a correlation coefficient (R) of -0.493 and weighted average of 13.6%, a difference of 17.1%.
Alaska Native vs Immigrants from Ecuador Master's Degree

Master's Degree Correlation Summary

MeasurementAlaska NativeImmigrants from Ecuador
Minimum0.50%3.1%
Maximum30.1%21.0%
Range29.6%17.9%
Mean8.0%11.9%
Median7.0%11.9%
Interquartile 25% (IQ1)3.5%10.2%
Interquartile 75% (IQ3)10.8%14.4%
Interquartile Range (IQR)7.2%4.2%
Standard Deviation (Sample)6.0%3.8%
Standard Deviation (Population)5.9%3.7%

Similar Demographics by Master's Degree

Demographics Similar to Alaska Natives by Master's Degree

In terms of master's degree, the demographic groups most similar to Alaska Natives are Hawaiian (11.6%, a difference of 0.10%), Immigrants from Guatemala (11.6%, a difference of 0.23%), Marshallese (11.6%, a difference of 0.25%), Alaskan Athabascan (11.6%, a difference of 0.26%), and Colville (11.6%, a difference of 0.35%).
DemographicsRating | RankMaster's Degree
Aleuts
0.1
/100
|
#286
Tragic
11.8%
Immigrants | Haiti
0.1
/100
|
#287
Tragic
11.8%
Immigrants | Honduras
0.1
/100
|
#288
Tragic
11.8%
Guatemalans
0.1
/100
|
#289
Tragic
11.7%
Ute
0.1
/100
|
#290
Tragic
11.7%
Colville
0.1
/100
|
#291
Tragic
11.6%
Immigrants | Guatemala
0.1
/100
|
#292
Tragic
11.6%
Alaska Natives
0.1
/100
|
#293
Tragic
11.6%
Hawaiians
0.1
/100
|
#294
Tragic
11.6%
Marshallese
0.1
/100
|
#295
Tragic
11.6%
Alaskan Athabascans
0.1
/100
|
#296
Tragic
11.6%
Immigrants | Yemen
0.1
/100
|
#297
Tragic
11.6%
Samoans
0.1
/100
|
#298
Tragic
11.5%
Chickasaw
0.1
/100
|
#299
Tragic
11.4%
Chippewa
0.1
/100
|
#300
Tragic
11.4%

Demographics Similar to Immigrants from Ecuador by Master's Degree

In terms of master's degree, the demographic groups most similar to Immigrants from Ecuador are Immigrants from Philippines (13.6%, a difference of 0.15%), Immigrants from Burma/Myanmar (13.5%, a difference of 0.50%), German Russian (13.5%, a difference of 0.91%), Immigrants from Guyana (13.4%, a difference of 1.0%), and Guyanese (13.7%, a difference of 1.0%).
DemographicsRating | RankMaster's Degree
Immigrants | St. Vincent and the Grenadines
11.0
/100
|
#226
Poor
13.9%
Immigrants | West Indies
9.8
/100
|
#227
Tragic
13.9%
Whites/Caucasians
9.1
/100
|
#228
Tragic
13.8%
British West Indians
8.8
/100
|
#229
Tragic
13.8%
Dutch
8.7
/100
|
#230
Tragic
13.8%
Guyanese
7.6
/100
|
#231
Tragic
13.7%
Immigrants | Philippines
6.0
/100
|
#232
Tragic
13.6%
Immigrants | Ecuador
5.7
/100
|
#233
Tragic
13.6%
Immigrants | Burma/Myanmar
5.0
/100
|
#234
Tragic
13.5%
German Russians
4.5
/100
|
#235
Tragic
13.5%
Immigrants | Guyana
4.4
/100
|
#236
Tragic
13.4%
Jamaicans
4.1
/100
|
#237
Tragic
13.4%
Hmong
4.0
/100
|
#238
Tragic
13.4%
Immigrants | Nonimmigrants
3.4
/100
|
#239
Tragic
13.3%
Guamanians/Chamorros
2.2
/100
|
#240
Tragic
13.1%