Alaska Native vs Immigrants from Uzbekistan Master's Degree
COMPARE
Alaska Native
Immigrants from Uzbekistan
Master's Degree
Master's Degree Comparison
Alaska Natives
Immigrants from Uzbekistan
11.6%
MASTER'S DEGREE
0.1/ 100
METRIC RATING
293rd/ 347
METRIC RANK
17.9%
MASTER'S DEGREE
99.8/ 100
METRIC RATING
69th/ 347
METRIC RANK
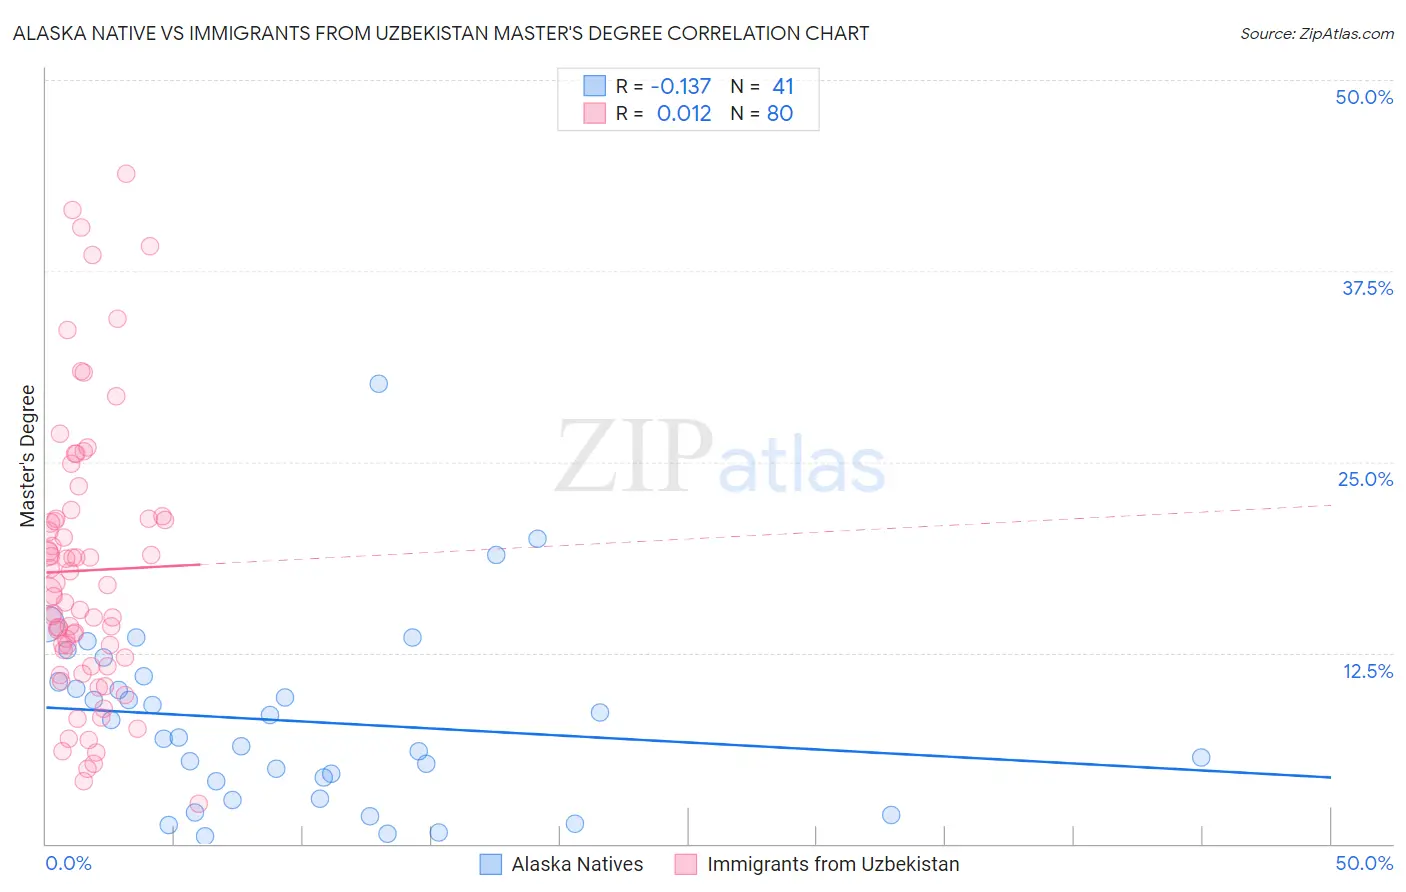
Alaska Native vs Immigrants from Uzbekistan Master's Degree Correlation Chart
The statistical analysis conducted on geographies consisting of 76,746,522 people shows a poor negative correlation between the proportion of Alaska Natives and percentage of population with at least master's degree education in the United States with a correlation coefficient (R) of -0.137 and weighted average of 11.6%. Similarly, the statistical analysis conducted on geographies consisting of 118,739,422 people shows no correlation between the proportion of Immigrants from Uzbekistan and percentage of population with at least master's degree education in the United States with a correlation coefficient (R) of 0.012 and weighted average of 17.9%, a difference of 54.0%.
Master's Degree Correlation Summary
| Measurement | Alaska Native | Immigrants from Uzbekistan |
| Minimum | 0.50% | 2.6% |
| Maximum | 30.1% | 43.9% |
| Range | 29.6% | 41.3% |
| Mean | 8.0% | 17.9% |
| Median | 7.0% | 16.3% |
| Interquartile 25% (IQ1) | 3.5% | 11.9% |
| Interquartile 75% (IQ3) | 10.8% | 21.3% |
| Interquartile Range (IQR) | 7.2% | 9.4% |
| Standard Deviation (Sample) | 6.0% | 9.0% |
| Standard Deviation (Population) | 5.9% | 9.0% |
Similar Demographics by Master's Degree
Demographics Similar to Alaska Natives by Master's Degree
In terms of master's degree, the demographic groups most similar to Alaska Natives are Hawaiian (11.6%, a difference of 0.10%), Immigrants from Guatemala (11.6%, a difference of 0.23%), Marshallese (11.6%, a difference of 0.25%), Alaskan Athabascan (11.6%, a difference of 0.26%), and Colville (11.6%, a difference of 0.35%).
| Demographics | Rating | Rank | Master's Degree |
| Aleuts | 0.1 /100 | #286 | Tragic 11.8% |
| Immigrants | Haiti | 0.1 /100 | #287 | Tragic 11.8% |
| Immigrants | Honduras | 0.1 /100 | #288 | Tragic 11.8% |
| Guatemalans | 0.1 /100 | #289 | Tragic 11.7% |
| Ute | 0.1 /100 | #290 | Tragic 11.7% |
| Colville | 0.1 /100 | #291 | Tragic 11.6% |
| Immigrants | Guatemala | 0.1 /100 | #292 | Tragic 11.6% |
| Alaska Natives | 0.1 /100 | #293 | Tragic 11.6% |
| Hawaiians | 0.1 /100 | #294 | Tragic 11.6% |
| Marshallese | 0.1 /100 | #295 | Tragic 11.6% |
| Alaskan Athabascans | 0.1 /100 | #296 | Tragic 11.6% |
| Immigrants | Yemen | 0.1 /100 | #297 | Tragic 11.6% |
| Samoans | 0.1 /100 | #298 | Tragic 11.5% |
| Chickasaw | 0.1 /100 | #299 | Tragic 11.4% |
| Chippewa | 0.1 /100 | #300 | Tragic 11.4% |
Demographics Similar to Immigrants from Uzbekistan by Master's Degree
In terms of master's degree, the demographic groups most similar to Immigrants from Uzbekistan are Immigrants from Western Europe (17.8%, a difference of 0.22%), Immigrants from Ethiopia (17.9%, a difference of 0.33%), Immigrants from Pakistan (17.8%, a difference of 0.50%), Immigrants from Argentina (18.0%, a difference of 0.55%), and Ethiopian (18.0%, a difference of 0.60%).
| Demographics | Rating | Rank | Master's Degree |
| Argentineans | 99.9 /100 | #62 | Exceptional 18.2% |
| Immigrants | Netherlands | 99.9 /100 | #63 | Exceptional 18.1% |
| South Africans | 99.9 /100 | #64 | Exceptional 18.1% |
| Immigrants | Kazakhstan | 99.8 /100 | #65 | Exceptional 18.0% |
| Ethiopians | 99.8 /100 | #66 | Exceptional 18.0% |
| Immigrants | Argentina | 99.8 /100 | #67 | Exceptional 18.0% |
| Immigrants | Ethiopia | 99.8 /100 | #68 | Exceptional 17.9% |
| Immigrants | Uzbekistan | 99.8 /100 | #69 | Exceptional 17.9% |
| Immigrants | Western Europe | 99.8 /100 | #70 | Exceptional 17.8% |
| Immigrants | Pakistan | 99.7 /100 | #71 | Exceptional 17.8% |
| Lithuanians | 99.7 /100 | #72 | Exceptional 17.7% |
| Zimbabweans | 99.7 /100 | #73 | Exceptional 17.7% |
| Immigrants | Romania | 99.7 /100 | #74 | Exceptional 17.7% |
| Egyptians | 99.6 /100 | #75 | Exceptional 17.6% |
| Immigrants | Indonesia | 99.6 /100 | #76 | Exceptional 17.6% |