Romanian vs Immigrants from Ecuador Master's Degree
COMPARE
Romanian
Immigrants from Ecuador
Master's Degree
Master's Degree Comparison
Romanians
Immigrants from Ecuador
17.2%
MASTER'S DEGREE
99.1/ 100
METRIC RATING
91st/ 347
METRIC RANK
13.6%
MASTER'S DEGREE
5.7/ 100
METRIC RATING
233rd/ 347
METRIC RANK
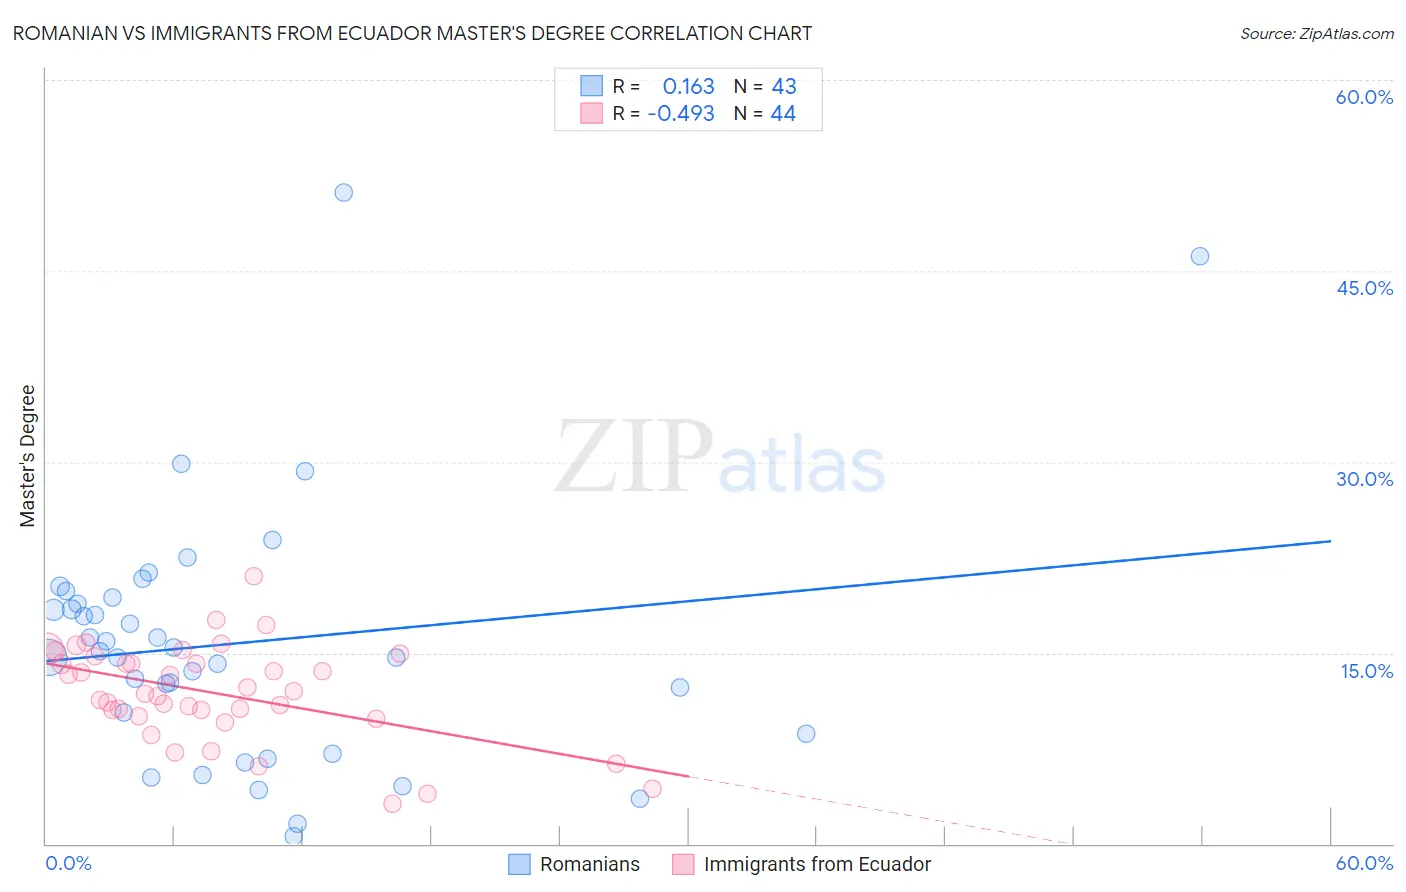
Romanian vs Immigrants from Ecuador Master's Degree Correlation Chart
The statistical analysis conducted on geographies consisting of 377,825,109 people shows a poor positive correlation between the proportion of Romanians and percentage of population with at least master's degree education in the United States with a correlation coefficient (R) of 0.163 and weighted average of 17.2%. Similarly, the statistical analysis conducted on geographies consisting of 270,930,295 people shows a moderate negative correlation between the proportion of Immigrants from Ecuador and percentage of population with at least master's degree education in the United States with a correlation coefficient (R) of -0.493 and weighted average of 13.6%, a difference of 26.4%.
Master's Degree Correlation Summary
| Measurement | Romanian | Immigrants from Ecuador |
| Minimum | 0.58% | 3.1% |
| Maximum | 51.2% | 21.0% |
| Range | 50.6% | 17.9% |
| Mean | 15.8% | 11.9% |
| Median | 15.1% | 11.9% |
| Interquartile 25% (IQ1) | 8.6% | 10.2% |
| Interquartile 75% (IQ3) | 19.4% | 14.4% |
| Interquartile Range (IQR) | 10.7% | 4.2% |
| Standard Deviation (Sample) | 10.1% | 3.8% |
| Standard Deviation (Population) | 9.9% | 3.7% |
Similar Demographics by Master's Degree
Demographics Similar to Romanians by Master's Degree
In terms of master's degree, the demographic groups most similar to Romanians are Immigrants from North America (17.2%, a difference of 0.050%), Immigrants from Egypt (17.2%, a difference of 0.070%), Bhutanese (17.2%, a difference of 0.090%), Immigrants from Italy (17.2%, a difference of 0.11%), and Immigrants from Canada (17.2%, a difference of 0.16%).
| Demographics | Rating | Rank | Master's Degree |
| Immigrants | Scotland | 99.4 /100 | #84 | Exceptional 17.4% |
| Immigrants | Brazil | 99.4 /100 | #85 | Exceptional 17.4% |
| Immigrants | Croatia | 99.3 /100 | #86 | Exceptional 17.3% |
| Maltese | 99.3 /100 | #87 | Exceptional 17.3% |
| Immigrants | Canada | 99.2 /100 | #88 | Exceptional 17.2% |
| Bhutanese | 99.1 /100 | #89 | Exceptional 17.2% |
| Immigrants | Egypt | 99.1 /100 | #90 | Exceptional 17.2% |
| Romanians | 99.1 /100 | #91 | Exceptional 17.2% |
| Immigrants | North America | 99.1 /100 | #92 | Exceptional 17.2% |
| Immigrants | Italy | 99.1 /100 | #93 | Exceptional 17.2% |
| Ugandans | 99.0 /100 | #94 | Exceptional 17.1% |
| Immigrants | Morocco | 98.9 /100 | #95 | Exceptional 17.1% |
| Immigrants | Northern Africa | 98.9 /100 | #96 | Exceptional 17.1% |
| Immigrants | England | 98.8 /100 | #97 | Exceptional 17.0% |
| Immigrants | Ukraine | 98.8 /100 | #98 | Exceptional 17.0% |
Demographics Similar to Immigrants from Ecuador by Master's Degree
In terms of master's degree, the demographic groups most similar to Immigrants from Ecuador are Immigrants from Philippines (13.6%, a difference of 0.15%), Immigrants from Burma/Myanmar (13.5%, a difference of 0.50%), German Russian (13.5%, a difference of 0.91%), Immigrants from Guyana (13.4%, a difference of 1.0%), and Guyanese (13.7%, a difference of 1.0%).
| Demographics | Rating | Rank | Master's Degree |
| Immigrants | St. Vincent and the Grenadines | 11.0 /100 | #226 | Poor 13.9% |
| Immigrants | West Indies | 9.8 /100 | #227 | Tragic 13.9% |
| Whites/Caucasians | 9.1 /100 | #228 | Tragic 13.8% |
| British West Indians | 8.8 /100 | #229 | Tragic 13.8% |
| Dutch | 8.7 /100 | #230 | Tragic 13.8% |
| Guyanese | 7.6 /100 | #231 | Tragic 13.7% |
| Immigrants | Philippines | 6.0 /100 | #232 | Tragic 13.6% |
| Immigrants | Ecuador | 5.7 /100 | #233 | Tragic 13.6% |
| Immigrants | Burma/Myanmar | 5.0 /100 | #234 | Tragic 13.5% |
| German Russians | 4.5 /100 | #235 | Tragic 13.5% |
| Immigrants | Guyana | 4.4 /100 | #236 | Tragic 13.4% |
| Jamaicans | 4.1 /100 | #237 | Tragic 13.4% |
| Hmong | 4.0 /100 | #238 | Tragic 13.4% |
| Immigrants | Nonimmigrants | 3.4 /100 | #239 | Tragic 13.3% |
| Guamanians/Chamorros | 2.2 /100 | #240 | Tragic 13.1% |