Alaska Native vs Immigrants from Indonesia Master's Degree
COMPARE
Alaska Native
Immigrants from Indonesia
Master's Degree
Master's Degree Comparison
Alaska Natives
Immigrants from Indonesia
11.6%
MASTER'S DEGREE
0.1/ 100
METRIC RATING
293rd/ 347
METRIC RANK
17.6%
MASTER'S DEGREE
99.6/ 100
METRIC RATING
76th/ 347
METRIC RANK
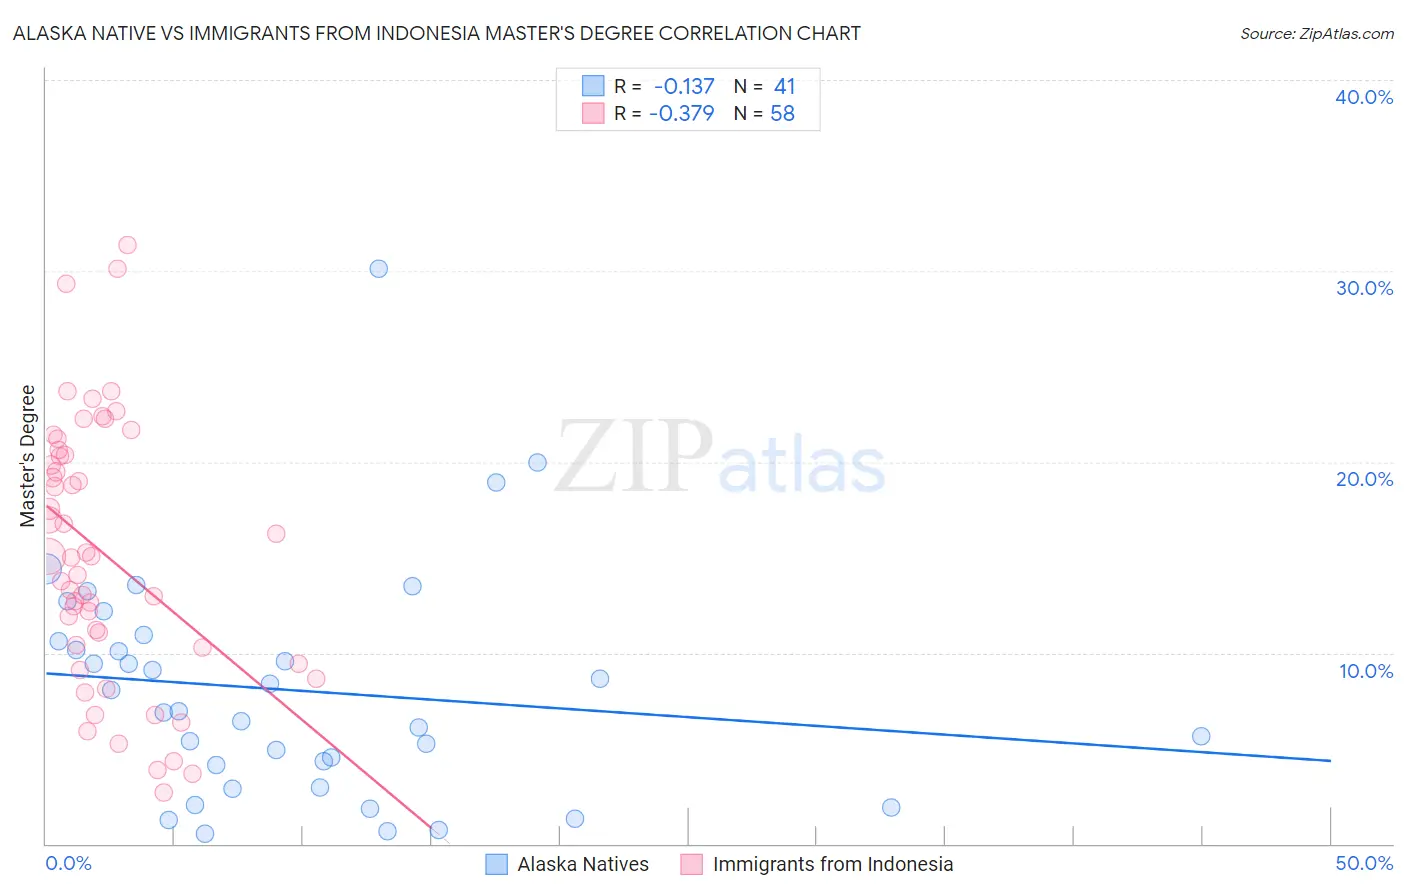
Alaska Native vs Immigrants from Indonesia Master's Degree Correlation Chart
The statistical analysis conducted on geographies consisting of 76,746,522 people shows a poor negative correlation between the proportion of Alaska Natives and percentage of population with at least master's degree education in the United States with a correlation coefficient (R) of -0.137 and weighted average of 11.6%. Similarly, the statistical analysis conducted on geographies consisting of 215,754,455 people shows a mild negative correlation between the proportion of Immigrants from Indonesia and percentage of population with at least master's degree education in the United States with a correlation coefficient (R) of -0.379 and weighted average of 17.6%, a difference of 51.7%.
Master's Degree Correlation Summary
| Measurement | Alaska Native | Immigrants from Indonesia |
| Minimum | 0.50% | 2.7% |
| Maximum | 30.1% | 31.4% |
| Range | 29.6% | 28.7% |
| Mean | 8.0% | 15.2% |
| Median | 7.0% | 15.0% |
| Interquartile 25% (IQ1) | 3.5% | 10.3% |
| Interquartile 75% (IQ3) | 10.8% | 20.4% |
| Interquartile Range (IQR) | 7.2% | 10.0% |
| Standard Deviation (Sample) | 6.0% | 6.9% |
| Standard Deviation (Population) | 5.9% | 6.8% |
Similar Demographics by Master's Degree
Demographics Similar to Alaska Natives by Master's Degree
In terms of master's degree, the demographic groups most similar to Alaska Natives are Hawaiian (11.6%, a difference of 0.10%), Immigrants from Guatemala (11.6%, a difference of 0.23%), Marshallese (11.6%, a difference of 0.25%), Alaskan Athabascan (11.6%, a difference of 0.26%), and Colville (11.6%, a difference of 0.35%).
| Demographics | Rating | Rank | Master's Degree |
| Aleuts | 0.1 /100 | #286 | Tragic 11.8% |
| Immigrants | Haiti | 0.1 /100 | #287 | Tragic 11.8% |
| Immigrants | Honduras | 0.1 /100 | #288 | Tragic 11.8% |
| Guatemalans | 0.1 /100 | #289 | Tragic 11.7% |
| Ute | 0.1 /100 | #290 | Tragic 11.7% |
| Colville | 0.1 /100 | #291 | Tragic 11.6% |
| Immigrants | Guatemala | 0.1 /100 | #292 | Tragic 11.6% |
| Alaska Natives | 0.1 /100 | #293 | Tragic 11.6% |
| Hawaiians | 0.1 /100 | #294 | Tragic 11.6% |
| Marshallese | 0.1 /100 | #295 | Tragic 11.6% |
| Alaskan Athabascans | 0.1 /100 | #296 | Tragic 11.6% |
| Immigrants | Yemen | 0.1 /100 | #297 | Tragic 11.6% |
| Samoans | 0.1 /100 | #298 | Tragic 11.5% |
| Chickasaw | 0.1 /100 | #299 | Tragic 11.4% |
| Chippewa | 0.1 /100 | #300 | Tragic 11.4% |
Demographics Similar to Immigrants from Indonesia by Master's Degree
In terms of master's degree, the demographic groups most similar to Immigrants from Indonesia are Egyptian (17.6%, a difference of 0.030%), Immigrants from Eastern Europe (17.6%, a difference of 0.12%), Immigrants from Hungary (17.5%, a difference of 0.31%), Immigrants from Romania (17.7%, a difference of 0.40%), and Immigrants from Lebanon (17.5%, a difference of 0.45%).
| Demographics | Rating | Rank | Master's Degree |
| Immigrants | Uzbekistan | 99.8 /100 | #69 | Exceptional 17.9% |
| Immigrants | Western Europe | 99.8 /100 | #70 | Exceptional 17.8% |
| Immigrants | Pakistan | 99.7 /100 | #71 | Exceptional 17.8% |
| Lithuanians | 99.7 /100 | #72 | Exceptional 17.7% |
| Zimbabweans | 99.7 /100 | #73 | Exceptional 17.7% |
| Immigrants | Romania | 99.7 /100 | #74 | Exceptional 17.7% |
| Egyptians | 99.6 /100 | #75 | Exceptional 17.6% |
| Immigrants | Indonesia | 99.6 /100 | #76 | Exceptional 17.6% |
| Immigrants | Eastern Europe | 99.6 /100 | #77 | Exceptional 17.6% |
| Immigrants | Hungary | 99.6 /100 | #78 | Exceptional 17.5% |
| Immigrants | Lebanon | 99.6 /100 | #79 | Exceptional 17.5% |
| Carpatho Rusyns | 99.6 /100 | #80 | Exceptional 17.5% |
| Immigrants | Western Asia | 99.5 /100 | #81 | Exceptional 17.5% |
| Greeks | 99.5 /100 | #82 | Exceptional 17.5% |
| Immigrants | Zimbabwe | 99.5 /100 | #83 | Exceptional 17.4% |