Alaska Native vs Immigrants from Syria Master's Degree
COMPARE
Alaska Native
Immigrants from Syria
Master's Degree
Master's Degree Comparison
Alaska Natives
Immigrants from Syria
11.6%
MASTER'S DEGREE
0.1/ 100
METRIC RATING
293rd/ 347
METRIC RANK
16.2%
MASTER'S DEGREE
93.3/ 100
METRIC RATING
129th/ 347
METRIC RANK
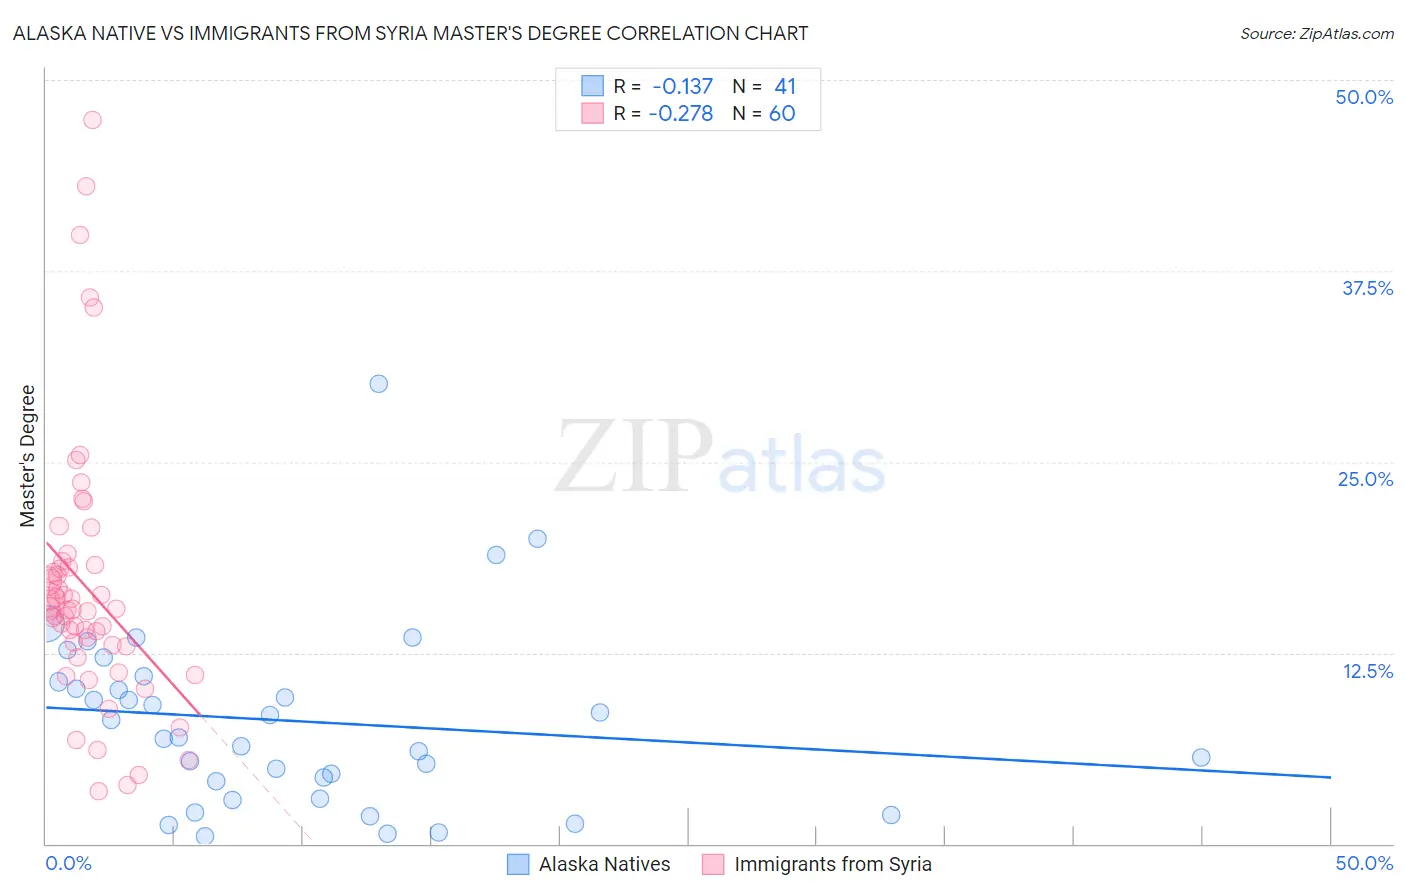
Alaska Native vs Immigrants from Syria Master's Degree Correlation Chart
The statistical analysis conducted on geographies consisting of 76,746,522 people shows a poor negative correlation between the proportion of Alaska Natives and percentage of population with at least master's degree education in the United States with a correlation coefficient (R) of -0.137 and weighted average of 11.6%. Similarly, the statistical analysis conducted on geographies consisting of 174,107,928 people shows a weak negative correlation between the proportion of Immigrants from Syria and percentage of population with at least master's degree education in the United States with a correlation coefficient (R) of -0.278 and weighted average of 16.2%, a difference of 39.4%.
Master's Degree Correlation Summary
| Measurement | Alaska Native | Immigrants from Syria |
| Minimum | 0.50% | 3.4% |
| Maximum | 30.1% | 47.4% |
| Range | 29.6% | 44.0% |
| Mean | 8.0% | 16.8% |
| Median | 7.0% | 15.3% |
| Interquartile 25% (IQ1) | 3.5% | 13.0% |
| Interquartile 75% (IQ3) | 10.8% | 18.2% |
| Interquartile Range (IQR) | 7.2% | 5.2% |
| Standard Deviation (Sample) | 6.0% | 8.7% |
| Standard Deviation (Population) | 5.9% | 8.6% |
Similar Demographics by Master's Degree
Demographics Similar to Alaska Natives by Master's Degree
In terms of master's degree, the demographic groups most similar to Alaska Natives are Hawaiian (11.6%, a difference of 0.10%), Immigrants from Guatemala (11.6%, a difference of 0.23%), Marshallese (11.6%, a difference of 0.25%), Alaskan Athabascan (11.6%, a difference of 0.26%), and Colville (11.6%, a difference of 0.35%).
| Demographics | Rating | Rank | Master's Degree |
| Aleuts | 0.1 /100 | #286 | Tragic 11.8% |
| Immigrants | Haiti | 0.1 /100 | #287 | Tragic 11.8% |
| Immigrants | Honduras | 0.1 /100 | #288 | Tragic 11.8% |
| Guatemalans | 0.1 /100 | #289 | Tragic 11.7% |
| Ute | 0.1 /100 | #290 | Tragic 11.7% |
| Colville | 0.1 /100 | #291 | Tragic 11.6% |
| Immigrants | Guatemala | 0.1 /100 | #292 | Tragic 11.6% |
| Alaska Natives | 0.1 /100 | #293 | Tragic 11.6% |
| Hawaiians | 0.1 /100 | #294 | Tragic 11.6% |
| Marshallese | 0.1 /100 | #295 | Tragic 11.6% |
| Alaskan Athabascans | 0.1 /100 | #296 | Tragic 11.6% |
| Immigrants | Yemen | 0.1 /100 | #297 | Tragic 11.6% |
| Samoans | 0.1 /100 | #298 | Tragic 11.5% |
| Chickasaw | 0.1 /100 | #299 | Tragic 11.4% |
| Chippewa | 0.1 /100 | #300 | Tragic 11.4% |
Demographics Similar to Immigrants from Syria by Master's Degree
In terms of master's degree, the demographic groups most similar to Immigrants from Syria are Immigrants from Jordan (16.1%, a difference of 0.26%), Taiwanese (16.1%, a difference of 0.58%), Serbian (16.1%, a difference of 0.67%), Immigrants from Sierra Leone (16.3%, a difference of 0.75%), and Palestinian (16.3%, a difference of 0.80%).
| Demographics | Rating | Rank | Master's Degree |
| British | 95.6 /100 | #122 | Exceptional 16.4% |
| Croatians | 95.6 /100 | #123 | Exceptional 16.4% |
| Immigrants | Eritrea | 95.5 /100 | #124 | Exceptional 16.4% |
| Italians | 95.4 /100 | #125 | Exceptional 16.4% |
| Immigrants | Eastern Africa | 95.2 /100 | #126 | Exceptional 16.3% |
| Palestinians | 94.8 /100 | #127 | Exceptional 16.3% |
| Immigrants | Sierra Leone | 94.7 /100 | #128 | Exceptional 16.3% |
| Immigrants | Syria | 93.3 /100 | #129 | Exceptional 16.2% |
| Immigrants | Jordan | 92.7 /100 | #130 | Exceptional 16.1% |
| Taiwanese | 91.9 /100 | #131 | Exceptional 16.1% |
| Serbians | 91.7 /100 | #132 | Exceptional 16.1% |
| Immigrants | Sudan | 90.2 /100 | #133 | Exceptional 16.0% |
| Venezuelans | 88.4 /100 | #134 | Excellent 15.9% |
| South American Indians | 88.4 /100 | #135 | Excellent 15.9% |
| Assyrians/Chaldeans/Syriacs | 86.8 /100 | #136 | Excellent 15.8% |