Alaska Native vs Immigrants from France Master's Degree
COMPARE
Alaska Native
Immigrants from France
Master's Degree
Master's Degree Comparison
Alaska Natives
Immigrants from France
11.6%
MASTER'S DEGREE
0.1/ 100
METRIC RATING
293rd/ 347
METRIC RANK
20.3%
MASTER'S DEGREE
100.0/ 100
METRIC RATING
23rd/ 347
METRIC RANK
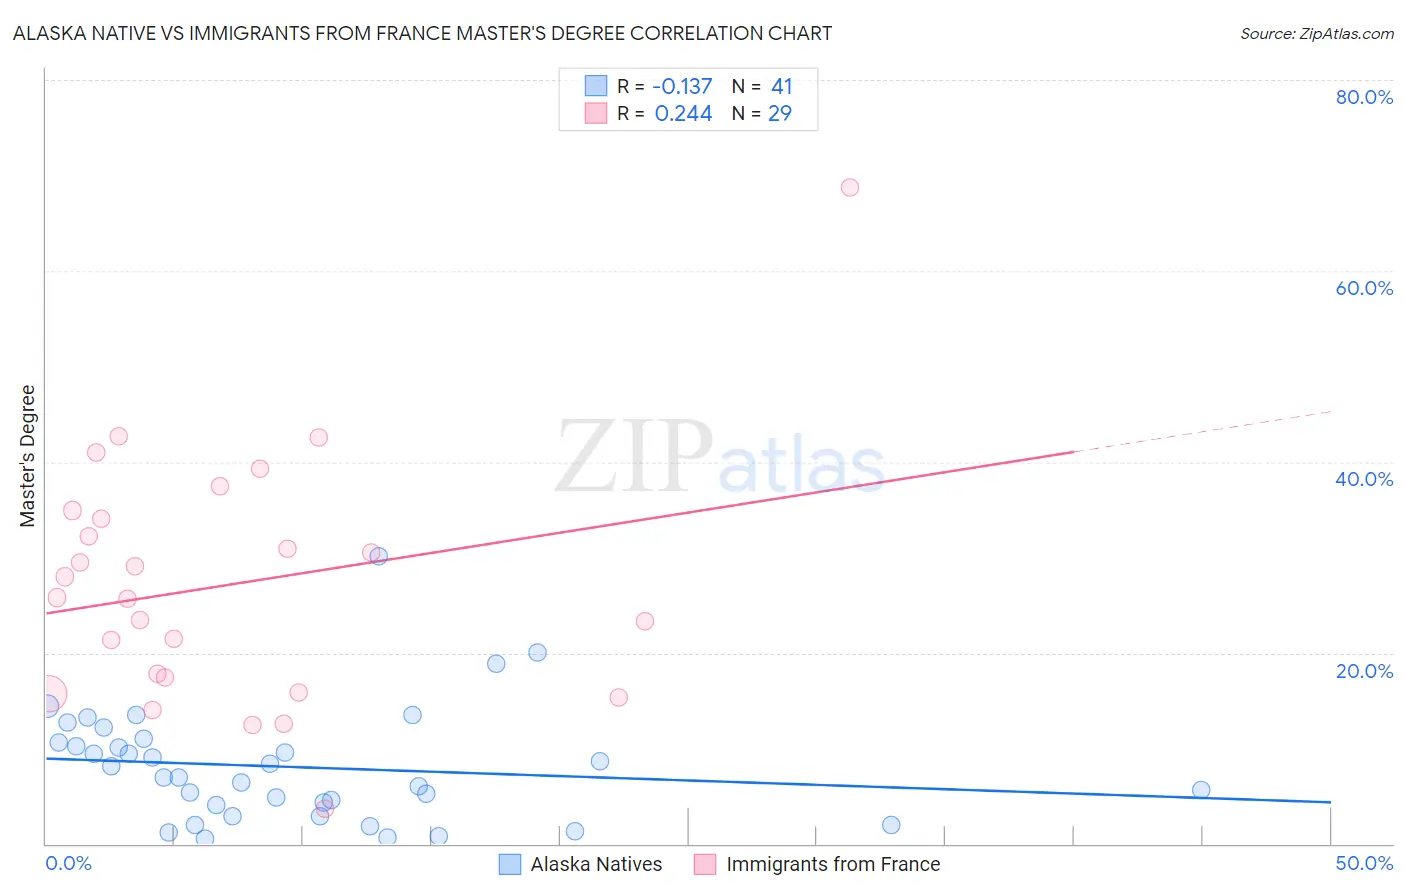
Alaska Native vs Immigrants from France Master's Degree Correlation Chart
The statistical analysis conducted on geographies consisting of 76,746,522 people shows a poor negative correlation between the proportion of Alaska Natives and percentage of population with at least master's degree education in the United States with a correlation coefficient (R) of -0.137 and weighted average of 11.6%. Similarly, the statistical analysis conducted on geographies consisting of 287,872,995 people shows a weak positive correlation between the proportion of Immigrants from France and percentage of population with at least master's degree education in the United States with a correlation coefficient (R) of 0.244 and weighted average of 20.3%, a difference of 74.9%.
Master's Degree Correlation Summary
| Measurement | Alaska Native | Immigrants from France |
| Minimum | 0.50% | 3.7% |
| Maximum | 30.1% | 68.8% |
| Range | 29.6% | 65.0% |
| Mean | 8.0% | 27.1% |
| Median | 7.0% | 25.8% |
| Interquartile 25% (IQ1) | 3.5% | 16.6% |
| Interquartile 75% (IQ3) | 10.8% | 34.4% |
| Interquartile Range (IQR) | 7.2% | 17.8% |
| Standard Deviation (Sample) | 6.0% | 12.9% |
| Standard Deviation (Population) | 5.9% | 12.7% |
Similar Demographics by Master's Degree
Demographics Similar to Alaska Natives by Master's Degree
In terms of master's degree, the demographic groups most similar to Alaska Natives are Hawaiian (11.6%, a difference of 0.10%), Immigrants from Guatemala (11.6%, a difference of 0.23%), Marshallese (11.6%, a difference of 0.25%), Alaskan Athabascan (11.6%, a difference of 0.26%), and Colville (11.6%, a difference of 0.35%).
| Demographics | Rating | Rank | Master's Degree |
| Aleuts | 0.1 /100 | #286 | Tragic 11.8% |
| Immigrants | Haiti | 0.1 /100 | #287 | Tragic 11.8% |
| Immigrants | Honduras | 0.1 /100 | #288 | Tragic 11.8% |
| Guatemalans | 0.1 /100 | #289 | Tragic 11.7% |
| Ute | 0.1 /100 | #290 | Tragic 11.7% |
| Colville | 0.1 /100 | #291 | Tragic 11.6% |
| Immigrants | Guatemala | 0.1 /100 | #292 | Tragic 11.6% |
| Alaska Natives | 0.1 /100 | #293 | Tragic 11.6% |
| Hawaiians | 0.1 /100 | #294 | Tragic 11.6% |
| Marshallese | 0.1 /100 | #295 | Tragic 11.6% |
| Alaskan Athabascans | 0.1 /100 | #296 | Tragic 11.6% |
| Immigrants | Yemen | 0.1 /100 | #297 | Tragic 11.6% |
| Samoans | 0.1 /100 | #298 | Tragic 11.5% |
| Chickasaw | 0.1 /100 | #299 | Tragic 11.4% |
| Chippewa | 0.1 /100 | #300 | Tragic 11.4% |
Demographics Similar to Immigrants from France by Master's Degree
In terms of master's degree, the demographic groups most similar to Immigrants from France are Immigrants from Sweden (20.3%, a difference of 0.070%), Israeli (20.3%, a difference of 0.28%), Immigrants from Ireland (20.4%, a difference of 0.70%), Indian (Asian) (20.5%, a difference of 0.81%), and Immigrants from Hong Kong (20.5%, a difference of 0.83%).
| Demographics | Rating | Rank | Master's Degree |
| Immigrants | Belgium | 100.0 /100 | #16 | Exceptional 20.8% |
| Immigrants | South Central Asia | 100.0 /100 | #17 | Exceptional 20.7% |
| Soviet Union | 100.0 /100 | #18 | Exceptional 20.5% |
| Immigrants | Hong Kong | 100.0 /100 | #19 | Exceptional 20.5% |
| Indians (Asian) | 100.0 /100 | #20 | Exceptional 20.5% |
| Immigrants | Ireland | 100.0 /100 | #21 | Exceptional 20.4% |
| Israelis | 100.0 /100 | #22 | Exceptional 20.3% |
| Immigrants | France | 100.0 /100 | #23 | Exceptional 20.3% |
| Immigrants | Sweden | 100.0 /100 | #24 | Exceptional 20.3% |
| Immigrants | Japan | 100.0 /100 | #25 | Exceptional 20.0% |
| Cambodians | 100.0 /100 | #26 | Exceptional 20.0% |
| Immigrants | Sri Lanka | 100.0 /100 | #27 | Exceptional 19.9% |
| Turks | 100.0 /100 | #28 | Exceptional 19.9% |
| Latvians | 100.0 /100 | #29 | Exceptional 19.8% |
| Immigrants | Turkey | 100.0 /100 | #30 | Exceptional 19.7% |