Spanish vs Immigrants from Ecuador Master's Degree
COMPARE
Spanish
Immigrants from Ecuador
Master's Degree
Master's Degree Comparison
Spanish
Immigrants from Ecuador
14.2%
MASTER'S DEGREE
17.8/ 100
METRIC RATING
212th/ 347
METRIC RANK
13.6%
MASTER'S DEGREE
5.7/ 100
METRIC RATING
233rd/ 347
METRIC RANK
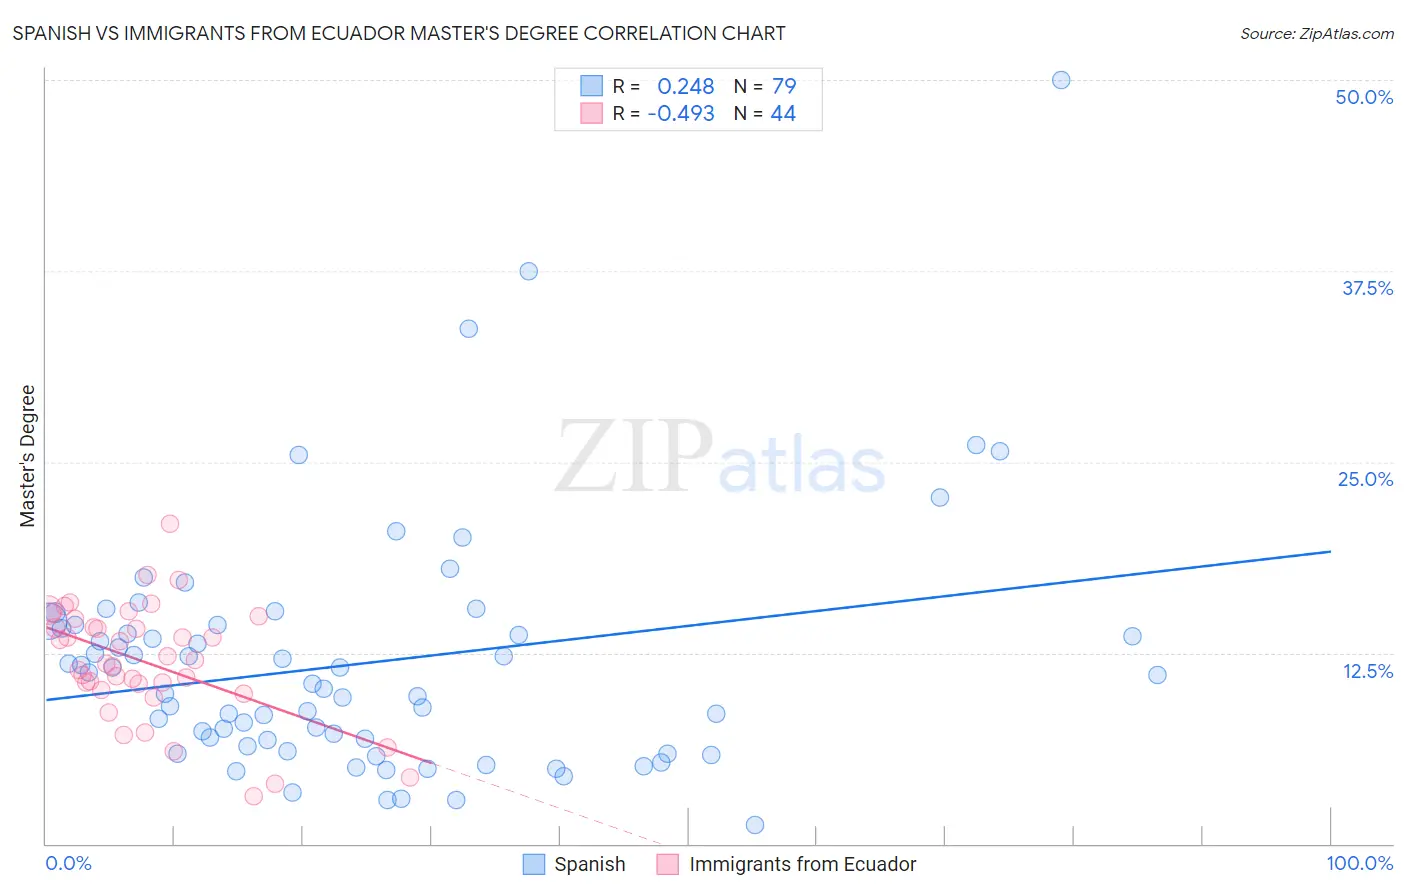
Spanish vs Immigrants from Ecuador Master's Degree Correlation Chart
The statistical analysis conducted on geographies consisting of 421,994,419 people shows a weak positive correlation between the proportion of Spanish and percentage of population with at least master's degree education in the United States with a correlation coefficient (R) of 0.248 and weighted average of 14.2%. Similarly, the statistical analysis conducted on geographies consisting of 270,930,295 people shows a moderate negative correlation between the proportion of Immigrants from Ecuador and percentage of population with at least master's degree education in the United States with a correlation coefficient (R) of -0.493 and weighted average of 13.6%, a difference of 4.5%.
Master's Degree Correlation Summary
| Measurement | Spanish | Immigrants from Ecuador |
| Minimum | 1.2% | 3.1% |
| Maximum | 50.0% | 21.0% |
| Range | 48.8% | 17.9% |
| Mean | 11.8% | 11.9% |
| Median | 10.5% | 11.9% |
| Interquartile 25% (IQ1) | 6.4% | 10.2% |
| Interquartile 75% (IQ3) | 14.3% | 14.4% |
| Interquartile Range (IQR) | 7.9% | 4.2% |
| Standard Deviation (Sample) | 8.0% | 3.8% |
| Standard Deviation (Population) | 7.9% | 3.7% |
Similar Demographics by Master's Degree
Demographics Similar to Spanish by Master's Degree
In terms of master's degree, the demographic groups most similar to Spanish are Somali (14.2%, a difference of 0.050%), Immigrants from Thailand (14.2%, a difference of 0.19%), Finnish (14.2%, a difference of 0.20%), Subsaharan African (14.2%, a difference of 0.36%), and Immigrants from Vietnam (14.1%, a difference of 0.41%).
| Demographics | Rating | Rank | Master's Degree |
| Trinidadians and Tobagonians | 23.5 /100 | #205 | Fair 14.4% |
| Scandinavians | 23.3 /100 | #206 | Fair 14.4% |
| Immigrants | Bosnia and Herzegovina | 22.0 /100 | #207 | Fair 14.3% |
| Immigrants | Barbados | 20.5 /100 | #208 | Fair 14.3% |
| Immigrants | Panama | 20.0 /100 | #209 | Fair 14.3% |
| Sub-Saharan Africans | 19.4 /100 | #210 | Poor 14.2% |
| Somalis | 18.0 /100 | #211 | Poor 14.2% |
| Spanish | 17.8 /100 | #212 | Poor 14.2% |
| Immigrants | Thailand | 17.0 /100 | #213 | Poor 14.2% |
| Finns | 16.9 /100 | #214 | Poor 14.2% |
| Immigrants | Vietnam | 16.1 /100 | #215 | Poor 14.1% |
| Immigrants | Somalia | 15.8 /100 | #216 | Poor 14.1% |
| Immigrants | Trinidad and Tobago | 15.8 /100 | #217 | Poor 14.1% |
| French Canadians | 14.9 /100 | #218 | Poor 14.1% |
| Norwegians | 13.6 /100 | #219 | Poor 14.0% |
Demographics Similar to Immigrants from Ecuador by Master's Degree
In terms of master's degree, the demographic groups most similar to Immigrants from Ecuador are Immigrants from Philippines (13.6%, a difference of 0.15%), Immigrants from Burma/Myanmar (13.5%, a difference of 0.50%), German Russian (13.5%, a difference of 0.91%), Immigrants from Guyana (13.4%, a difference of 1.0%), and Guyanese (13.7%, a difference of 1.0%).
| Demographics | Rating | Rank | Master's Degree |
| Immigrants | St. Vincent and the Grenadines | 11.0 /100 | #226 | Poor 13.9% |
| Immigrants | West Indies | 9.8 /100 | #227 | Tragic 13.9% |
| Whites/Caucasians | 9.1 /100 | #228 | Tragic 13.8% |
| British West Indians | 8.8 /100 | #229 | Tragic 13.8% |
| Dutch | 8.7 /100 | #230 | Tragic 13.8% |
| Guyanese | 7.6 /100 | #231 | Tragic 13.7% |
| Immigrants | Philippines | 6.0 /100 | #232 | Tragic 13.6% |
| Immigrants | Ecuador | 5.7 /100 | #233 | Tragic 13.6% |
| Immigrants | Burma/Myanmar | 5.0 /100 | #234 | Tragic 13.5% |
| German Russians | 4.5 /100 | #235 | Tragic 13.5% |
| Immigrants | Guyana | 4.4 /100 | #236 | Tragic 13.4% |
| Jamaicans | 4.1 /100 | #237 | Tragic 13.4% |
| Hmong | 4.0 /100 | #238 | Tragic 13.4% |
| Immigrants | Nonimmigrants | 3.4 /100 | #239 | Tragic 13.3% |
| Guamanians/Chamorros | 2.2 /100 | #240 | Tragic 13.1% |