Malaysian vs Immigrants from Ecuador Master's Degree
COMPARE
Malaysian
Immigrants from Ecuador
Master's Degree
Master's Degree Comparison
Malaysians
Immigrants from Ecuador
12.0%
MASTER'S DEGREE
0.2/ 100
METRIC RATING
281st/ 347
METRIC RANK
13.6%
MASTER'S DEGREE
5.7/ 100
METRIC RATING
233rd/ 347
METRIC RANK
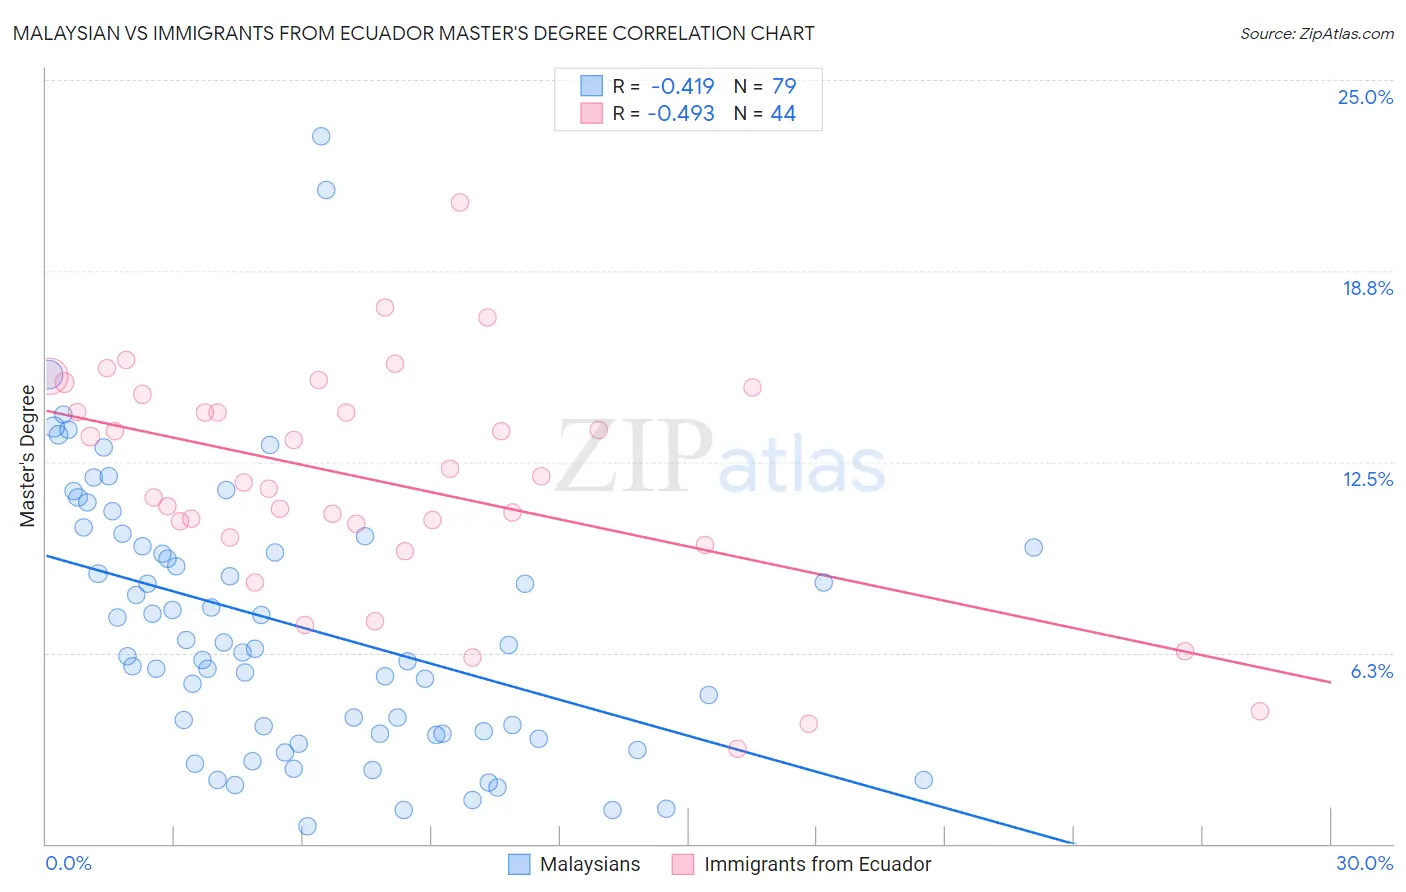
Malaysian vs Immigrants from Ecuador Master's Degree Correlation Chart
The statistical analysis conducted on geographies consisting of 226,048,565 people shows a moderate negative correlation between the proportion of Malaysians and percentage of population with at least master's degree education in the United States with a correlation coefficient (R) of -0.419 and weighted average of 12.0%. Similarly, the statistical analysis conducted on geographies consisting of 270,930,295 people shows a moderate negative correlation between the proportion of Immigrants from Ecuador and percentage of population with at least master's degree education in the United States with a correlation coefficient (R) of -0.493 and weighted average of 13.6%, a difference of 12.9%.
Master's Degree Correlation Summary
| Measurement | Malaysian | Immigrants from Ecuador |
| Minimum | 0.56% | 3.1% |
| Maximum | 23.1% | 21.0% |
| Range | 22.6% | 17.9% |
| Mean | 7.1% | 11.9% |
| Median | 6.4% | 11.9% |
| Interquartile 25% (IQ1) | 3.6% | 10.2% |
| Interquartile 75% (IQ3) | 9.7% | 14.4% |
| Interquartile Range (IQR) | 6.1% | 4.2% |
| Standard Deviation (Sample) | 4.5% | 3.8% |
| Standard Deviation (Population) | 4.5% | 3.7% |
Similar Demographics by Master's Degree
Demographics Similar to Malaysians by Master's Degree
In terms of master's degree, the demographic groups most similar to Malaysians are Immigrants from Dominican Republic (12.1%, a difference of 0.12%), Immigrants from Belize (12.1%, a difference of 0.18%), Immigrants from Caribbean (12.1%, a difference of 0.26%), Potawatomi (12.1%, a difference of 0.26%), and Black/African American (12.1%, a difference of 0.27%).
| Demographics | Rating | Rank | Master's Degree |
| Cape Verdeans | 0.3 /100 | #274 | Tragic 12.1% |
| Cubans | 0.3 /100 | #275 | Tragic 12.1% |
| Blacks/African Americans | 0.3 /100 | #276 | Tragic 12.1% |
| Immigrants | Caribbean | 0.3 /100 | #277 | Tragic 12.1% |
| Potawatomi | 0.3 /100 | #278 | Tragic 12.1% |
| Immigrants | Belize | 0.2 /100 | #279 | Tragic 12.1% |
| Immigrants | Dominican Republic | 0.2 /100 | #280 | Tragic 12.1% |
| Malaysians | 0.2 /100 | #281 | Tragic 12.0% |
| Immigrants | El Salvador | 0.2 /100 | #282 | Tragic 12.0% |
| Hondurans | 0.2 /100 | #283 | Tragic 11.9% |
| Ottawa | 0.2 /100 | #284 | Tragic 11.9% |
| Immigrants | Nicaragua | 0.2 /100 | #285 | Tragic 11.8% |
| Aleuts | 0.1 /100 | #286 | Tragic 11.8% |
| Immigrants | Haiti | 0.1 /100 | #287 | Tragic 11.8% |
| Immigrants | Honduras | 0.1 /100 | #288 | Tragic 11.8% |
Demographics Similar to Immigrants from Ecuador by Master's Degree
In terms of master's degree, the demographic groups most similar to Immigrants from Ecuador are Immigrants from Philippines (13.6%, a difference of 0.15%), Immigrants from Burma/Myanmar (13.5%, a difference of 0.50%), German Russian (13.5%, a difference of 0.91%), Immigrants from Guyana (13.4%, a difference of 1.0%), and Guyanese (13.7%, a difference of 1.0%).
| Demographics | Rating | Rank | Master's Degree |
| Immigrants | St. Vincent and the Grenadines | 11.0 /100 | #226 | Poor 13.9% |
| Immigrants | West Indies | 9.8 /100 | #227 | Tragic 13.9% |
| Whites/Caucasians | 9.1 /100 | #228 | Tragic 13.8% |
| British West Indians | 8.8 /100 | #229 | Tragic 13.8% |
| Dutch | 8.7 /100 | #230 | Tragic 13.8% |
| Guyanese | 7.6 /100 | #231 | Tragic 13.7% |
| Immigrants | Philippines | 6.0 /100 | #232 | Tragic 13.6% |
| Immigrants | Ecuador | 5.7 /100 | #233 | Tragic 13.6% |
| Immigrants | Burma/Myanmar | 5.0 /100 | #234 | Tragic 13.5% |
| German Russians | 4.5 /100 | #235 | Tragic 13.5% |
| Immigrants | Guyana | 4.4 /100 | #236 | Tragic 13.4% |
| Jamaicans | 4.1 /100 | #237 | Tragic 13.4% |
| Hmong | 4.0 /100 | #238 | Tragic 13.4% |
| Immigrants | Nonimmigrants | 3.4 /100 | #239 | Tragic 13.3% |
| Guamanians/Chamorros | 2.2 /100 | #240 | Tragic 13.1% |