Alaska Native vs Yugoslavian Master's Degree
COMPARE
Alaska Native
Yugoslavian
Master's Degree
Master's Degree Comparison
Alaska Natives
Yugoslavians
11.6%
MASTER'S DEGREE
0.1/ 100
METRIC RATING
293rd/ 347
METRIC RANK
14.4%
MASTER'S DEGREE
24.3/ 100
METRIC RATING
203rd/ 347
METRIC RANK
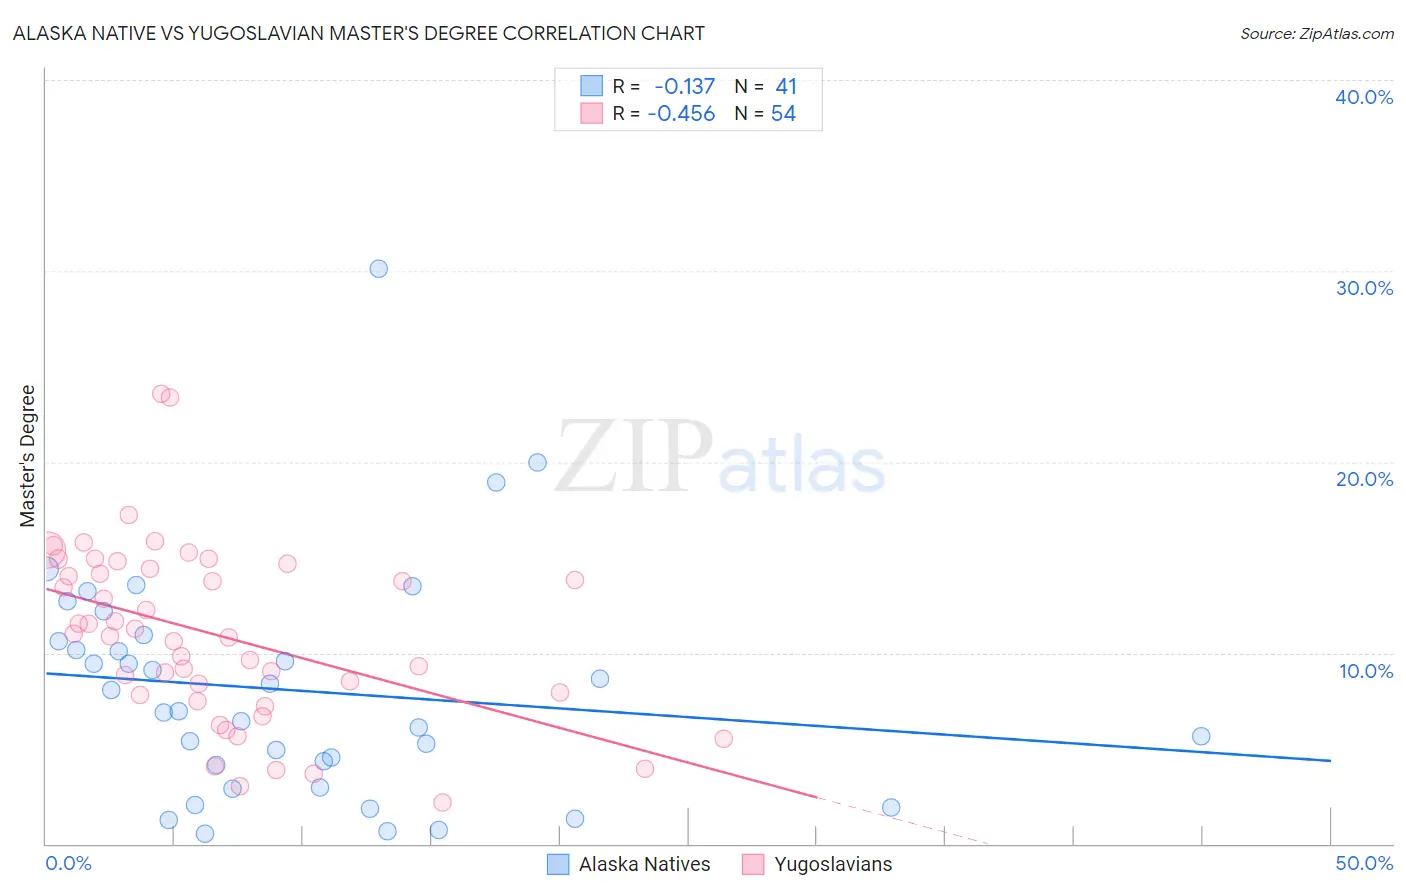
Alaska Native vs Yugoslavian Master's Degree Correlation Chart
The statistical analysis conducted on geographies consisting of 76,746,522 people shows a poor negative correlation between the proportion of Alaska Natives and percentage of population with at least master's degree education in the United States with a correlation coefficient (R) of -0.137 and weighted average of 11.6%. Similarly, the statistical analysis conducted on geographies consisting of 285,661,106 people shows a moderate negative correlation between the proportion of Yugoslavians and percentage of population with at least master's degree education in the United States with a correlation coefficient (R) of -0.456 and weighted average of 14.4%, a difference of 23.9%.
Master's Degree Correlation Summary
| Measurement | Alaska Native | Yugoslavian |
| Minimum | 0.50% | 2.2% |
| Maximum | 30.1% | 23.6% |
| Range | 29.6% | 21.4% |
| Mean | 8.0% | 10.9% |
| Median | 7.0% | 10.9% |
| Interquartile 25% (IQ1) | 3.5% | 7.8% |
| Interquartile 75% (IQ3) | 10.8% | 14.4% |
| Interquartile Range (IQR) | 7.2% | 6.6% |
| Standard Deviation (Sample) | 6.0% | 4.7% |
| Standard Deviation (Population) | 5.9% | 4.6% |
Similar Demographics by Master's Degree
Demographics Similar to Alaska Natives by Master's Degree
In terms of master's degree, the demographic groups most similar to Alaska Natives are Hawaiian (11.6%, a difference of 0.10%), Immigrants from Guatemala (11.6%, a difference of 0.23%), Marshallese (11.6%, a difference of 0.25%), Alaskan Athabascan (11.6%, a difference of 0.26%), and Colville (11.6%, a difference of 0.35%).
| Demographics | Rating | Rank | Master's Degree |
| Aleuts | 0.1 /100 | #286 | Tragic 11.8% |
| Immigrants | Haiti | 0.1 /100 | #287 | Tragic 11.8% |
| Immigrants | Honduras | 0.1 /100 | #288 | Tragic 11.8% |
| Guatemalans | 0.1 /100 | #289 | Tragic 11.7% |
| Ute | 0.1 /100 | #290 | Tragic 11.7% |
| Colville | 0.1 /100 | #291 | Tragic 11.6% |
| Immigrants | Guatemala | 0.1 /100 | #292 | Tragic 11.6% |
| Alaska Natives | 0.1 /100 | #293 | Tragic 11.6% |
| Hawaiians | 0.1 /100 | #294 | Tragic 11.6% |
| Marshallese | 0.1 /100 | #295 | Tragic 11.6% |
| Alaskan Athabascans | 0.1 /100 | #296 | Tragic 11.6% |
| Immigrants | Yemen | 0.1 /100 | #297 | Tragic 11.6% |
| Samoans | 0.1 /100 | #298 | Tragic 11.5% |
| Chickasaw | 0.1 /100 | #299 | Tragic 11.4% |
| Chippewa | 0.1 /100 | #300 | Tragic 11.4% |
Demographics Similar to Yugoslavians by Master's Degree
In terms of master's degree, the demographic groups most similar to Yugoslavians are Immigrants from Western Africa (14.4%, a difference of 0.11%), French (14.4%, a difference of 0.11%), Panamanian (14.4%, a difference of 0.13%), Scotch-Irish (14.4%, a difference of 0.13%), and Trinidadian and Tobagonian (14.4%, a difference of 0.15%).
| Demographics | Rating | Rank | Master's Degree |
| Czechoslovakians | 29.9 /100 | #196 | Fair 14.5% |
| Belgians | 28.0 /100 | #197 | Fair 14.5% |
| West Indians | 27.4 /100 | #198 | Fair 14.5% |
| Immigrants | Armenia | 27.2 /100 | #199 | Fair 14.5% |
| Panamanians | 25.1 /100 | #200 | Fair 14.4% |
| Scotch-Irish | 25.0 /100 | #201 | Fair 14.4% |
| Immigrants | Western Africa | 24.9 /100 | #202 | Fair 14.4% |
| Yugoslavians | 24.3 /100 | #203 | Fair 14.4% |
| French | 23.7 /100 | #204 | Fair 14.4% |
| Trinidadians and Tobagonians | 23.5 /100 | #205 | Fair 14.4% |
| Scandinavians | 23.3 /100 | #206 | Fair 14.4% |
| Immigrants | Bosnia and Herzegovina | 22.0 /100 | #207 | Fair 14.3% |
| Immigrants | Barbados | 20.5 /100 | #208 | Fair 14.3% |
| Immigrants | Panama | 20.0 /100 | #209 | Fair 14.3% |
| Sub-Saharan Africans | 19.4 /100 | #210 | Poor 14.2% |