Alaska Native vs Immigrants from Ecuador Family Households
COMPARE
Alaska Native
Immigrants from Ecuador
Family Households
Family Households Comparison
Alaska Natives
Immigrants from Ecuador
65.1%
FAMILY HOUSEHOLDS
97.3/ 100
METRIC RATING
107th/ 347
METRIC RANK
64.8%
FAMILY HOUSEHOLDS
91.4/ 100
METRIC RATING
129th/ 347
METRIC RANK
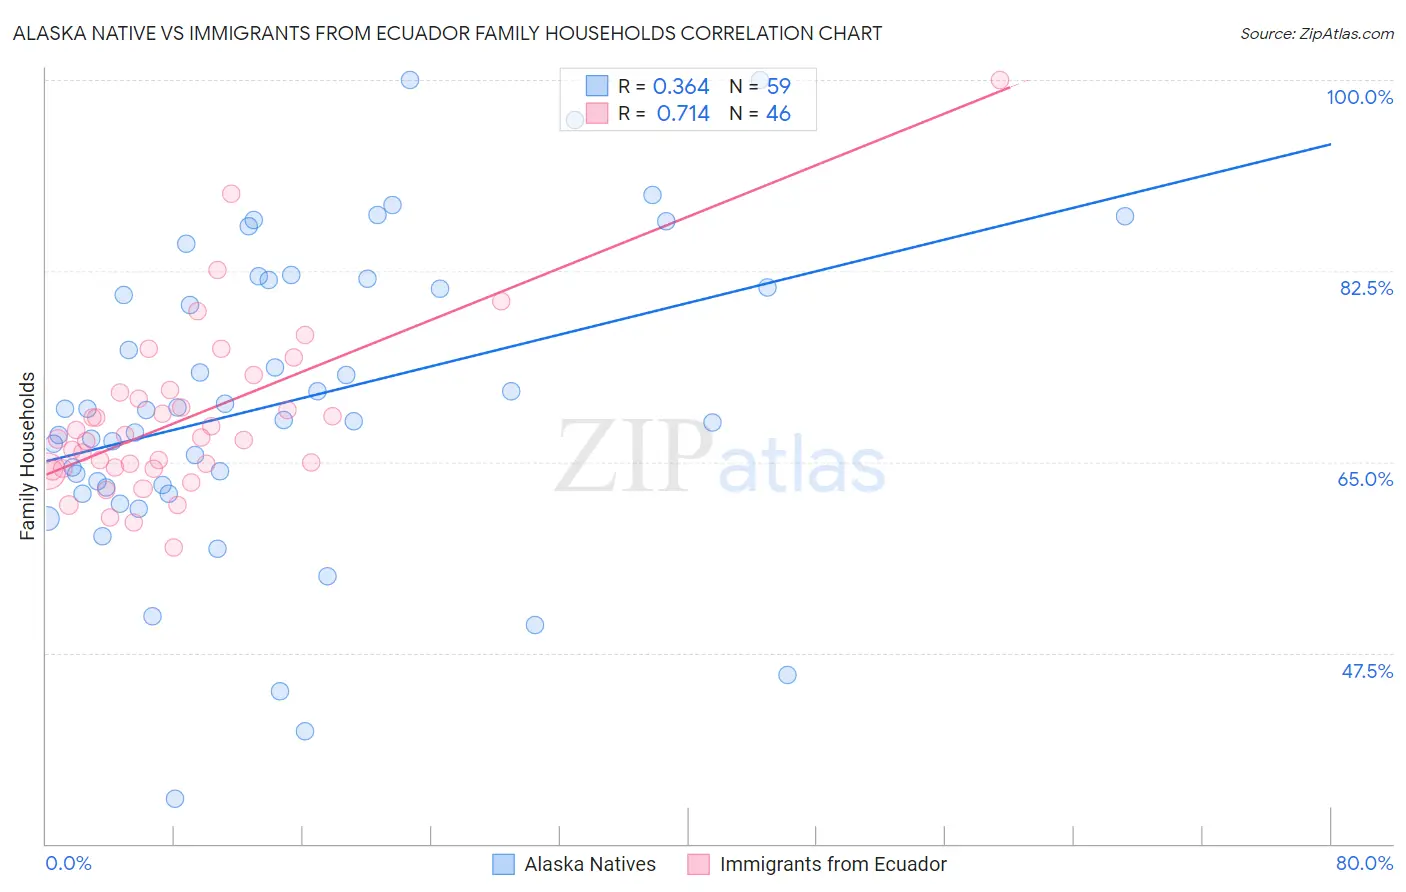
Alaska Native vs Immigrants from Ecuador Family Households Correlation Chart
The statistical analysis conducted on geographies consisting of 76,756,415 people shows a mild positive correlation between the proportion of Alaska Natives and percentage of family households in the United States with a correlation coefficient (R) of 0.364 and weighted average of 65.1%. Similarly, the statistical analysis conducted on geographies consisting of 270,888,190 people shows a strong positive correlation between the proportion of Immigrants from Ecuador and percentage of family households in the United States with a correlation coefficient (R) of 0.714 and weighted average of 64.8%, a difference of 0.41%.
Family Households Correlation Summary
| Measurement | Alaska Native | Immigrants from Ecuador |
| Minimum | 34.1% | 57.2% |
| Maximum | 100.0% | 100.0% |
| Range | 65.9% | 42.8% |
| Mean | 70.5% | 69.0% |
| Median | 69.7% | 67.2% |
| Interquartile 25% (IQ1) | 62.6% | 64.4% |
| Interquartile 75% (IQ3) | 81.7% | 71.4% |
| Interquartile Range (IQR) | 19.1% | 7.0% |
| Standard Deviation (Sample) | 14.0% | 7.8% |
| Standard Deviation (Population) | 13.9% | 7.8% |
Similar Demographics by Family Households
Demographics Similar to Alaska Natives by Family Households
In terms of family households, the demographic groups most similar to Alaska Natives are White/Caucasian (65.1%, a difference of 0.0%), English (65.1%, a difference of 0.010%), Palestinian (65.1%, a difference of 0.010%), Immigrants from Guatemala (65.0%, a difference of 0.050%), and Scandinavian (65.0%, a difference of 0.060%).
| Demographics | Rating | Rank | Family Households |
| Haitians | 98.1 /100 | #100 | Exceptional 65.2% |
| Chileans | 98.1 /100 | #101 | Exceptional 65.2% |
| Immigrants | Sri Lanka | 98.0 /100 | #102 | Exceptional 65.1% |
| Indians (Asian) | 97.9 /100 | #103 | Exceptional 65.1% |
| Spaniards | 97.8 /100 | #104 | Exceptional 65.1% |
| English | 97.4 /100 | #105 | Exceptional 65.1% |
| Whites/Caucasians | 97.3 /100 | #106 | Exceptional 65.1% |
| Alaska Natives | 97.3 /100 | #107 | Exceptional 65.1% |
| Palestinians | 97.2 /100 | #108 | Exceptional 65.1% |
| Immigrants | Guatemala | 96.9 /100 | #109 | Exceptional 65.0% |
| Scandinavians | 96.8 /100 | #110 | Exceptional 65.0% |
| Europeans | 96.8 /100 | #111 | Exceptional 65.0% |
| Immigrants | Jordan | 96.5 /100 | #112 | Exceptional 65.0% |
| Spanish | 96.2 /100 | #113 | Exceptional 65.0% |
| Argentineans | 95.7 /100 | #114 | Exceptional 65.0% |
Demographics Similar to Immigrants from Ecuador by Family Households
In terms of family households, the demographic groups most similar to Immigrants from Ecuador are Italian (64.8%, a difference of 0.020%), Immigrants from Panama (64.8%, a difference of 0.030%), Panamanian (64.8%, a difference of 0.050%), Immigrants from Italy (64.8%, a difference of 0.050%), and Nonimmigrants (64.8%, a difference of 0.050%).
| Demographics | Rating | Rank | Family Households |
| Hmong | 93.4 /100 | #122 | Exceptional 64.9% |
| Choctaw | 93.4 /100 | #123 | Exceptional 64.9% |
| Immigrants | Argentina | 92.8 /100 | #124 | Exceptional 64.9% |
| Immigrants | Belize | 92.7 /100 | #125 | Exceptional 64.9% |
| Panamanians | 92.4 /100 | #126 | Exceptional 64.8% |
| Immigrants | Panama | 92.0 /100 | #127 | Exceptional 64.8% |
| Italians | 91.9 /100 | #128 | Exceptional 64.8% |
| Immigrants | Ecuador | 91.4 /100 | #129 | Exceptional 64.8% |
| Immigrants | Italy | 90.2 /100 | #130 | Exceptional 64.8% |
| Immigrants | Nonimmigrants | 90.1 /100 | #131 | Exceptional 64.8% |
| Cajuns | 89.4 /100 | #132 | Excellent 64.8% |
| Belizeans | 89.3 /100 | #133 | Excellent 64.8% |
| Greeks | 88.1 /100 | #134 | Excellent 64.7% |
| Maltese | 87.4 /100 | #135 | Excellent 64.7% |
| Immigrants | China | 86.6 /100 | #136 | Excellent 64.7% |