Israeli vs Immigrants from Ecuador Master's Degree
COMPARE
Israeli
Immigrants from Ecuador
Master's Degree
Master's Degree Comparison
Israelis
Immigrants from Ecuador
20.3%
MASTER'S DEGREE
100.0/ 100
METRIC RATING
22nd/ 347
METRIC RANK
13.6%
MASTER'S DEGREE
5.7/ 100
METRIC RATING
233rd/ 347
METRIC RANK
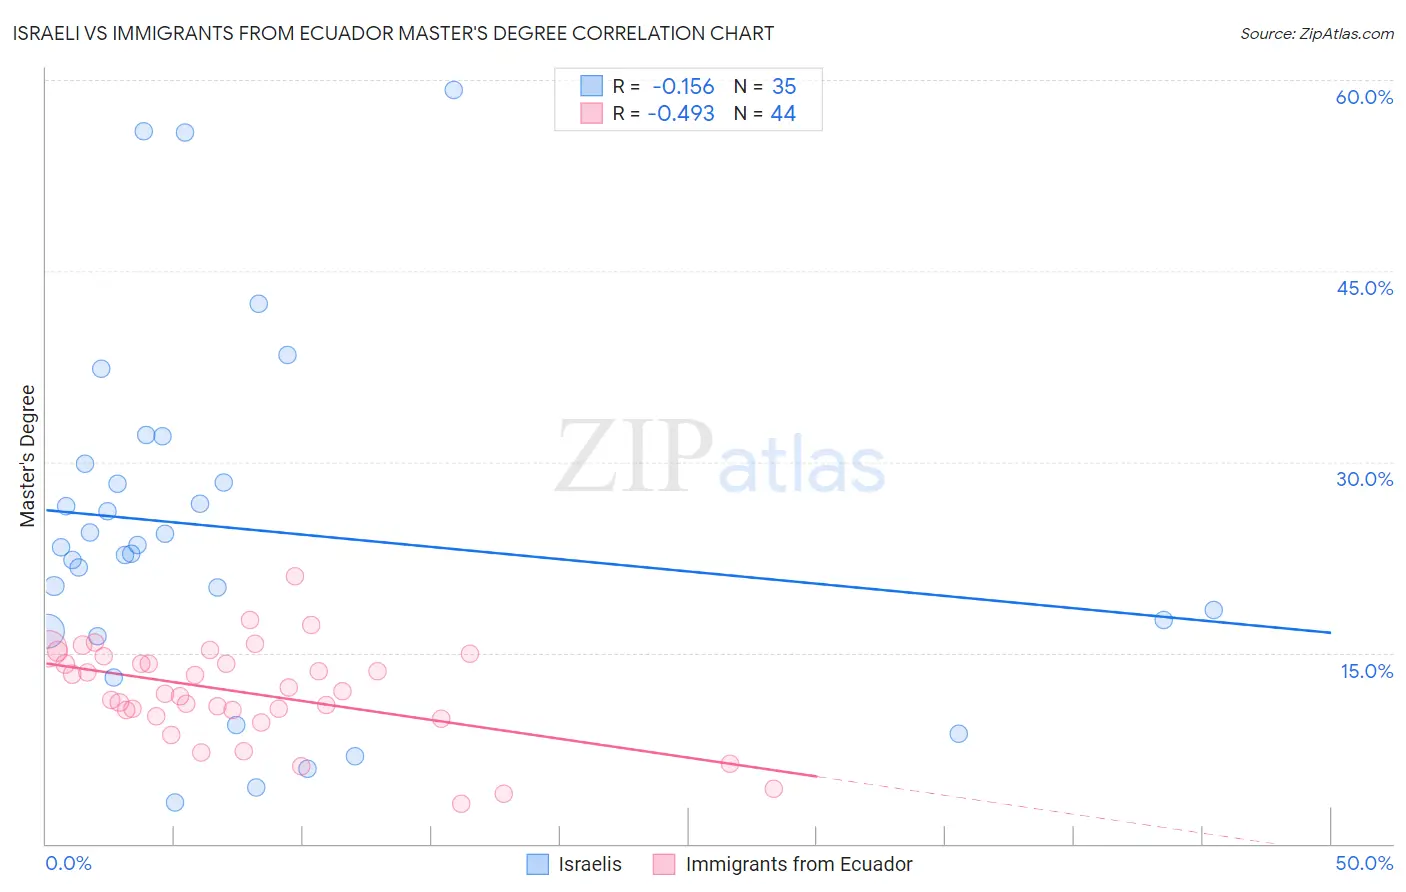
Israeli vs Immigrants from Ecuador Master's Degree Correlation Chart
The statistical analysis conducted on geographies consisting of 211,131,712 people shows a poor negative correlation between the proportion of Israelis and percentage of population with at least master's degree education in the United States with a correlation coefficient (R) of -0.156 and weighted average of 20.3%. Similarly, the statistical analysis conducted on geographies consisting of 270,930,295 people shows a moderate negative correlation between the proportion of Immigrants from Ecuador and percentage of population with at least master's degree education in the United States with a correlation coefficient (R) of -0.493 and weighted average of 13.6%, a difference of 49.7%.
Master's Degree Correlation Summary
| Measurement | Israeli | Immigrants from Ecuador |
| Minimum | 3.2% | 3.1% |
| Maximum | 59.3% | 21.0% |
| Range | 56.0% | 17.9% |
| Mean | 24.7% | 11.9% |
| Median | 23.3% | 11.9% |
| Interquartile 25% (IQ1) | 16.7% | 10.2% |
| Interquartile 75% (IQ3) | 29.9% | 14.4% |
| Interquartile Range (IQR) | 13.2% | 4.2% |
| Standard Deviation (Sample) | 13.8% | 3.8% |
| Standard Deviation (Population) | 13.6% | 3.7% |
Similar Demographics by Master's Degree
Demographics Similar to Israelis by Master's Degree
In terms of master's degree, the demographic groups most similar to Israelis are Immigrants from France (20.3%, a difference of 0.28%), Immigrants from Sweden (20.3%, a difference of 0.35%), Immigrants from Ireland (20.4%, a difference of 0.42%), Indian (Asian) (20.5%, a difference of 0.53%), and Immigrants from Hong Kong (20.5%, a difference of 0.55%).
| Demographics | Rating | Rank | Master's Degree |
| Immigrants | Eastern Asia | 100.0 /100 | #15 | Exceptional 20.8% |
| Immigrants | Belgium | 100.0 /100 | #16 | Exceptional 20.8% |
| Immigrants | South Central Asia | 100.0 /100 | #17 | Exceptional 20.7% |
| Soviet Union | 100.0 /100 | #18 | Exceptional 20.5% |
| Immigrants | Hong Kong | 100.0 /100 | #19 | Exceptional 20.5% |
| Indians (Asian) | 100.0 /100 | #20 | Exceptional 20.5% |
| Immigrants | Ireland | 100.0 /100 | #21 | Exceptional 20.4% |
| Israelis | 100.0 /100 | #22 | Exceptional 20.3% |
| Immigrants | France | 100.0 /100 | #23 | Exceptional 20.3% |
| Immigrants | Sweden | 100.0 /100 | #24 | Exceptional 20.3% |
| Immigrants | Japan | 100.0 /100 | #25 | Exceptional 20.0% |
| Cambodians | 100.0 /100 | #26 | Exceptional 20.0% |
| Immigrants | Sri Lanka | 100.0 /100 | #27 | Exceptional 19.9% |
| Turks | 100.0 /100 | #28 | Exceptional 19.9% |
| Latvians | 100.0 /100 | #29 | Exceptional 19.8% |
Demographics Similar to Immigrants from Ecuador by Master's Degree
In terms of master's degree, the demographic groups most similar to Immigrants from Ecuador are Immigrants from Philippines (13.6%, a difference of 0.15%), Immigrants from Burma/Myanmar (13.5%, a difference of 0.50%), German Russian (13.5%, a difference of 0.91%), Immigrants from Guyana (13.4%, a difference of 1.0%), and Guyanese (13.7%, a difference of 1.0%).
| Demographics | Rating | Rank | Master's Degree |
| Immigrants | St. Vincent and the Grenadines | 11.0 /100 | #226 | Poor 13.9% |
| Immigrants | West Indies | 9.8 /100 | #227 | Tragic 13.9% |
| Whites/Caucasians | 9.1 /100 | #228 | Tragic 13.8% |
| British West Indians | 8.8 /100 | #229 | Tragic 13.8% |
| Dutch | 8.7 /100 | #230 | Tragic 13.8% |
| Guyanese | 7.6 /100 | #231 | Tragic 13.7% |
| Immigrants | Philippines | 6.0 /100 | #232 | Tragic 13.6% |
| Immigrants | Ecuador | 5.7 /100 | #233 | Tragic 13.6% |
| Immigrants | Burma/Myanmar | 5.0 /100 | #234 | Tragic 13.5% |
| German Russians | 4.5 /100 | #235 | Tragic 13.5% |
| Immigrants | Guyana | 4.4 /100 | #236 | Tragic 13.4% |
| Jamaicans | 4.1 /100 | #237 | Tragic 13.4% |
| Hmong | 4.0 /100 | #238 | Tragic 13.4% |
| Immigrants | Nonimmigrants | 3.4 /100 | #239 | Tragic 13.3% |
| Guamanians/Chamorros | 2.2 /100 | #240 | Tragic 13.1% |