Alaska Native vs Immigrants from Canada Master's Degree
COMPARE
Alaska Native
Immigrants from Canada
Master's Degree
Master's Degree Comparison
Alaska Natives
Immigrants from Canada
11.6%
MASTER'S DEGREE
0.1/ 100
METRIC RATING
293rd/ 347
METRIC RANK
17.2%
MASTER'S DEGREE
99.2/ 100
METRIC RATING
88th/ 347
METRIC RANK
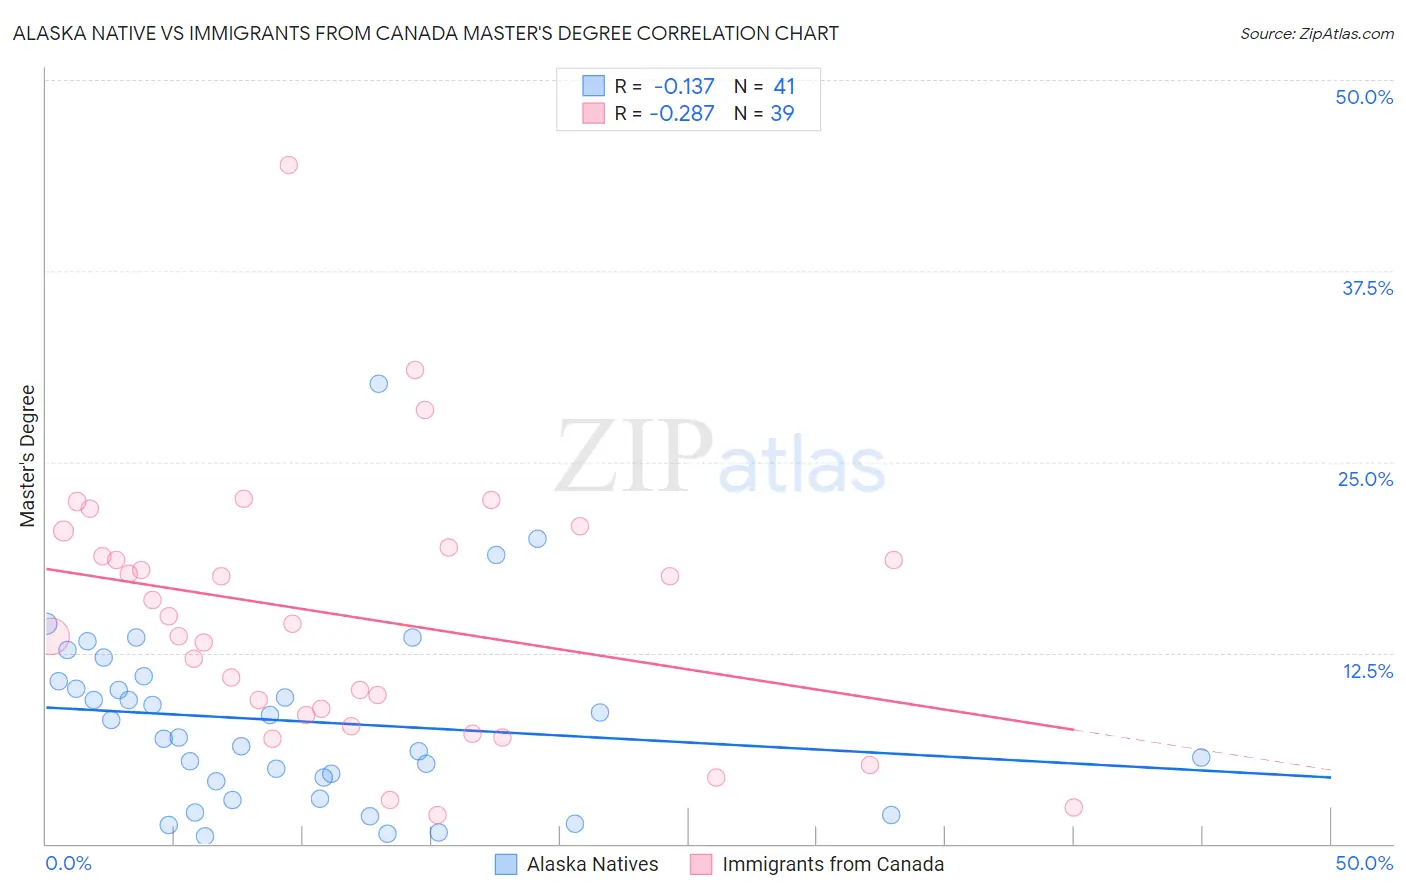
Alaska Native vs Immigrants from Canada Master's Degree Correlation Chart
The statistical analysis conducted on geographies consisting of 76,746,522 people shows a poor negative correlation between the proportion of Alaska Natives and percentage of population with at least master's degree education in the United States with a correlation coefficient (R) of -0.137 and weighted average of 11.6%. Similarly, the statistical analysis conducted on geographies consisting of 459,222,681 people shows a weak negative correlation between the proportion of Immigrants from Canada and percentage of population with at least master's degree education in the United States with a correlation coefficient (R) of -0.287 and weighted average of 17.2%, a difference of 48.3%.
Master's Degree Correlation Summary
| Measurement | Alaska Native | Immigrants from Canada |
| Minimum | 0.50% | 1.9% |
| Maximum | 30.1% | 44.5% |
| Range | 29.6% | 42.5% |
| Mean | 8.0% | 14.9% |
| Median | 7.0% | 14.4% |
| Interquartile 25% (IQ1) | 3.5% | 8.4% |
| Interquartile 75% (IQ3) | 10.8% | 19.4% |
| Interquartile Range (IQR) | 7.2% | 11.0% |
| Standard Deviation (Sample) | 6.0% | 8.6% |
| Standard Deviation (Population) | 5.9% | 8.5% |
Similar Demographics by Master's Degree
Demographics Similar to Alaska Natives by Master's Degree
In terms of master's degree, the demographic groups most similar to Alaska Natives are Hawaiian (11.6%, a difference of 0.10%), Immigrants from Guatemala (11.6%, a difference of 0.23%), Marshallese (11.6%, a difference of 0.25%), Alaskan Athabascan (11.6%, a difference of 0.26%), and Colville (11.6%, a difference of 0.35%).
| Demographics | Rating | Rank | Master's Degree |
| Aleuts | 0.1 /100 | #286 | Tragic 11.8% |
| Immigrants | Haiti | 0.1 /100 | #287 | Tragic 11.8% |
| Immigrants | Honduras | 0.1 /100 | #288 | Tragic 11.8% |
| Guatemalans | 0.1 /100 | #289 | Tragic 11.7% |
| Ute | 0.1 /100 | #290 | Tragic 11.7% |
| Colville | 0.1 /100 | #291 | Tragic 11.6% |
| Immigrants | Guatemala | 0.1 /100 | #292 | Tragic 11.6% |
| Alaska Natives | 0.1 /100 | #293 | Tragic 11.6% |
| Hawaiians | 0.1 /100 | #294 | Tragic 11.6% |
| Marshallese | 0.1 /100 | #295 | Tragic 11.6% |
| Alaskan Athabascans | 0.1 /100 | #296 | Tragic 11.6% |
| Immigrants | Yemen | 0.1 /100 | #297 | Tragic 11.6% |
| Samoans | 0.1 /100 | #298 | Tragic 11.5% |
| Chickasaw | 0.1 /100 | #299 | Tragic 11.4% |
| Chippewa | 0.1 /100 | #300 | Tragic 11.4% |
Demographics Similar to Immigrants from Canada by Master's Degree
In terms of master's degree, the demographic groups most similar to Immigrants from Canada are Bhutanese (17.2%, a difference of 0.070%), Immigrants from Egypt (17.2%, a difference of 0.090%), Romanian (17.2%, a difference of 0.16%), Immigrants from North America (17.2%, a difference of 0.21%), and Immigrants from Italy (17.2%, a difference of 0.27%).
| Demographics | Rating | Rank | Master's Degree |
| Immigrants | Western Asia | 99.5 /100 | #81 | Exceptional 17.5% |
| Greeks | 99.5 /100 | #82 | Exceptional 17.5% |
| Immigrants | Zimbabwe | 99.5 /100 | #83 | Exceptional 17.4% |
| Immigrants | Scotland | 99.4 /100 | #84 | Exceptional 17.4% |
| Immigrants | Brazil | 99.4 /100 | #85 | Exceptional 17.4% |
| Immigrants | Croatia | 99.3 /100 | #86 | Exceptional 17.3% |
| Maltese | 99.3 /100 | #87 | Exceptional 17.3% |
| Immigrants | Canada | 99.2 /100 | #88 | Exceptional 17.2% |
| Bhutanese | 99.1 /100 | #89 | Exceptional 17.2% |
| Immigrants | Egypt | 99.1 /100 | #90 | Exceptional 17.2% |
| Romanians | 99.1 /100 | #91 | Exceptional 17.2% |
| Immigrants | North America | 99.1 /100 | #92 | Exceptional 17.2% |
| Immigrants | Italy | 99.1 /100 | #93 | Exceptional 17.2% |
| Ugandans | 99.0 /100 | #94 | Exceptional 17.1% |
| Immigrants | Morocco | 98.9 /100 | #95 | Exceptional 17.1% |