Yup'ik vs Immigrants from Uzbekistan Disability Age Over 75
COMPARE
Yup'ik
Immigrants from Uzbekistan
Disability Age Over 75
Disability Age Over 75 Comparison
Yup'ik
Immigrants from Uzbekistan
61.1%
DISABILITY AGE OVER 75
0.0/ 100
METRIC RATING
347th/ 347
METRIC RANK
49.2%
DISABILITY AGE OVER 75
0.1/ 100
METRIC RATING
276th/ 347
METRIC RANK
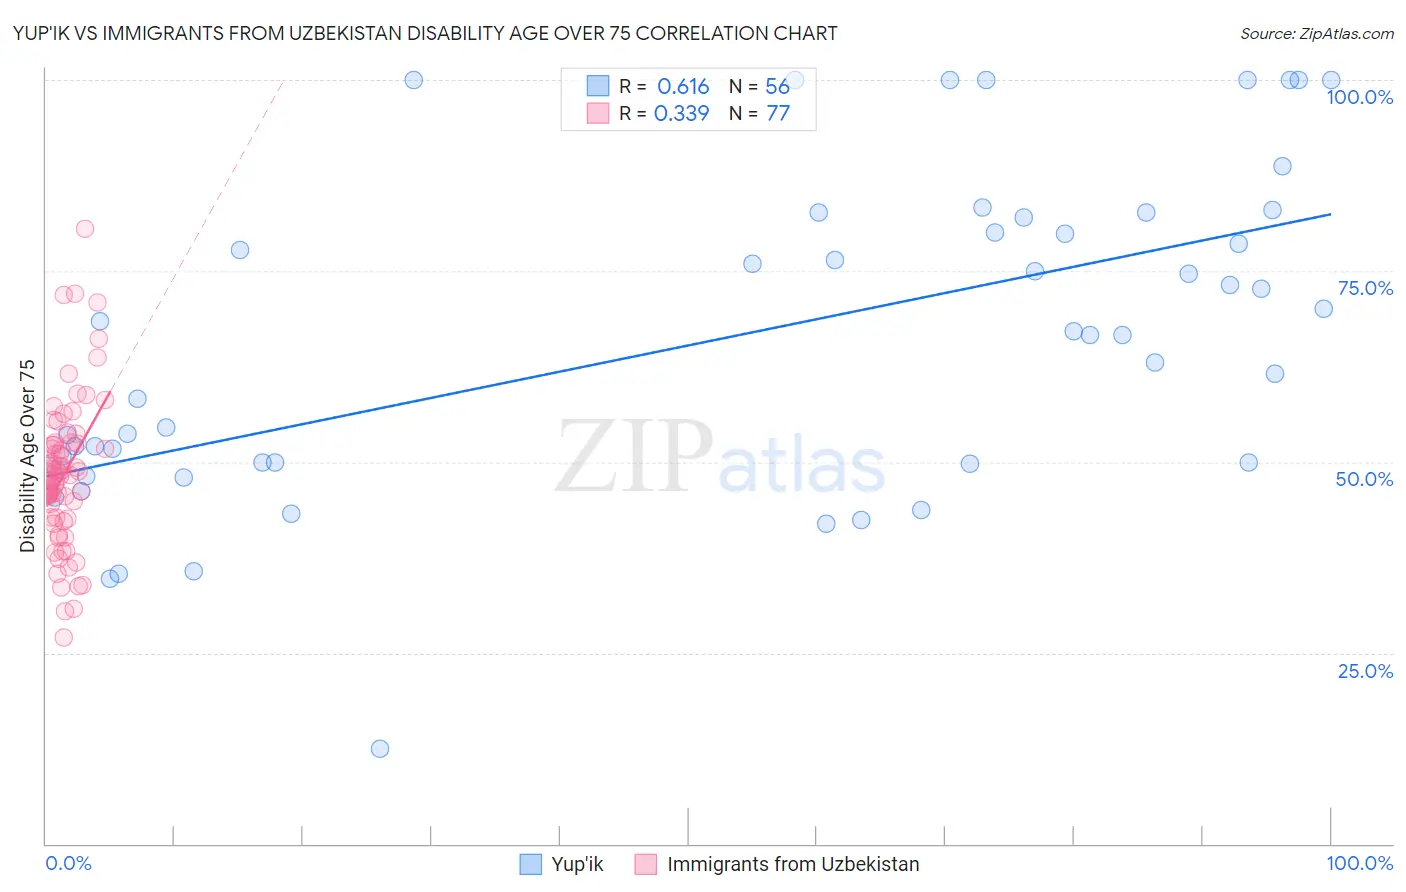
Yup'ik vs Immigrants from Uzbekistan Disability Age Over 75 Correlation Chart
The statistical analysis conducted on geographies consisting of 39,925,791 people shows a significant positive correlation between the proportion of Yup'ik and percentage of population with a disability over the age of 75 in the United States with a correlation coefficient (R) of 0.616 and weighted average of 61.1%. Similarly, the statistical analysis conducted on geographies consisting of 118,571,316 people shows a mild positive correlation between the proportion of Immigrants from Uzbekistan and percentage of population with a disability over the age of 75 in the United States with a correlation coefficient (R) of 0.339 and weighted average of 49.2%, a difference of 24.3%.
Disability Age Over 75 Correlation Summary
| Measurement | Yup'ik | Immigrants from Uzbekistan |
| Minimum | 12.5% | 27.0% |
| Maximum | 100.0% | 80.4% |
| Range | 87.5% | 53.5% |
| Mean | 65.7% | 48.4% |
| Median | 66.7% | 48.2% |
| Interquartile 25% (IQ1) | 49.8% | 42.6% |
| Interquartile 75% (IQ3) | 81.0% | 52.5% |
| Interquartile Range (IQR) | 31.2% | 9.9% |
| Standard Deviation (Sample) | 21.0% | 9.8% |
| Standard Deviation (Population) | 20.8% | 9.7% |
Similar Demographics by Disability Age Over 75
Demographics Similar to Yup'ik by Disability Age Over 75
In terms of disability age over 75, the demographic groups most similar to Yup'ik are Tsimshian (59.2%, a difference of 3.2%), Inupiat (58.4%, a difference of 4.6%), Navajo (58.3%, a difference of 4.9%), Tohono O'odham (56.7%, a difference of 7.7%), and Lumbee (56.2%, a difference of 8.6%).
| Demographics | Rating | Rank | Disability Age Over 75 |
| Apache | 0.0 /100 | #333 | Tragic 53.6% |
| Alaskan Athabascans | 0.0 /100 | #334 | Tragic 54.0% |
| Kiowa | 0.0 /100 | #335 | Tragic 54.2% |
| Immigrants | Armenia | 0.0 /100 | #336 | Tragic 54.3% |
| Yuman | 0.0 /100 | #337 | Tragic 54.4% |
| Colville | 0.0 /100 | #338 | Tragic 55.4% |
| Pima | 0.0 /100 | #339 | Tragic 55.8% |
| Pueblo | 0.0 /100 | #340 | Tragic 55.9% |
| Houma | 0.0 /100 | #341 | Tragic 56.2% |
| Lumbee | 0.0 /100 | #342 | Tragic 56.2% |
| Tohono O'odham | 0.0 /100 | #343 | Tragic 56.7% |
| Navajo | 0.0 /100 | #344 | Tragic 58.3% |
| Inupiat | 0.0 /100 | #345 | Tragic 58.4% |
| Tsimshian | 0.0 /100 | #346 | Tragic 59.2% |
| Yup'ik | 0.0 /100 | #347 | Tragic 61.1% |
Demographics Similar to Immigrants from Uzbekistan by Disability Age Over 75
In terms of disability age over 75, the demographic groups most similar to Immigrants from Uzbekistan are Hawaiian (49.2%, a difference of 0.020%), Immigrants from Laos (49.2%, a difference of 0.060%), Immigrants from Dominica (49.1%, a difference of 0.12%), Immigrants from Guatemala (49.1%, a difference of 0.13%), and Immigrants from Iraq (49.1%, a difference of 0.20%).
| Demographics | Rating | Rank | Disability Age Over 75 |
| Immigrants | El Salvador | 0.2 /100 | #269 | Tragic 49.0% |
| Potawatomi | 0.2 /100 | #270 | Tragic 49.0% |
| Fijians | 0.2 /100 | #271 | Tragic 49.0% |
| Assyrians/Chaldeans/Syriacs | 0.2 /100 | #272 | Tragic 49.1% |
| Immigrants | Iraq | 0.1 /100 | #273 | Tragic 49.1% |
| Immigrants | Guatemala | 0.1 /100 | #274 | Tragic 49.1% |
| Immigrants | Dominica | 0.1 /100 | #275 | Tragic 49.1% |
| Immigrants | Uzbekistan | 0.1 /100 | #276 | Tragic 49.2% |
| Hawaiians | 0.1 /100 | #277 | Tragic 49.2% |
| Immigrants | Laos | 0.1 /100 | #278 | Tragic 49.2% |
| Guamanians/Chamorros | 0.0 /100 | #279 | Tragic 49.4% |
| Bangladeshis | 0.0 /100 | #280 | Tragic 49.4% |
| Belizeans | 0.0 /100 | #281 | Tragic 49.4% |
| Blacks/African Americans | 0.0 /100 | #282 | Tragic 49.5% |
| Samoans | 0.0 /100 | #283 | Tragic 49.5% |