Arab vs Immigrants from Uzbekistan Disability Age Over 75
COMPARE
Arab
Immigrants from Uzbekistan
Disability Age Over 75
Disability Age Over 75 Comparison
Arabs
Immigrants from Uzbekistan
47.1%
DISABILITY AGE OVER 75
73.3/ 100
METRIC RATING
156th/ 347
METRIC RANK
49.2%
DISABILITY AGE OVER 75
0.1/ 100
METRIC RATING
276th/ 347
METRIC RANK
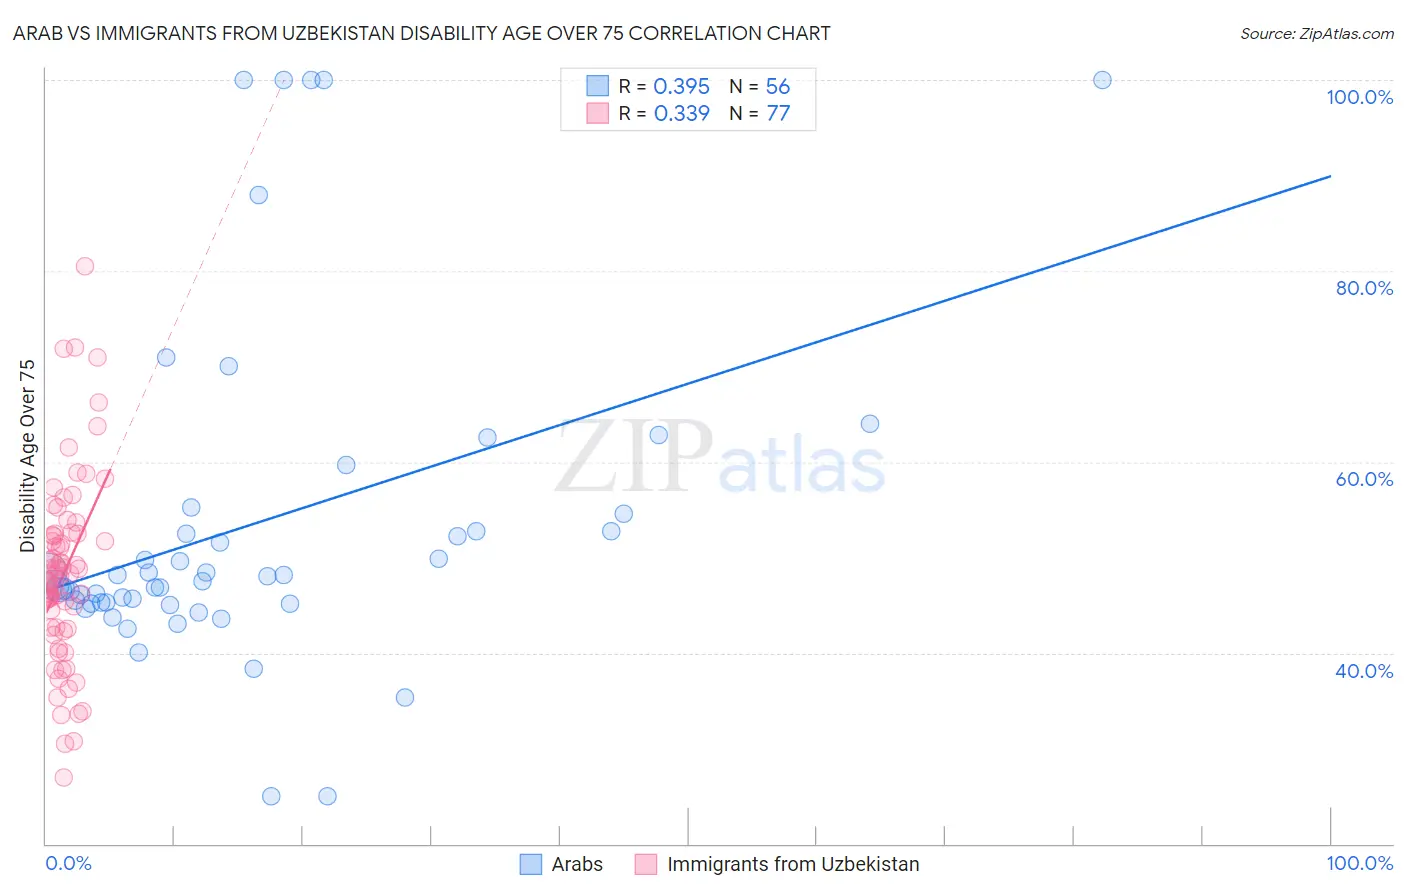
Arab vs Immigrants from Uzbekistan Disability Age Over 75 Correlation Chart
The statistical analysis conducted on geographies consisting of 485,582,526 people shows a mild positive correlation between the proportion of Arabs and percentage of population with a disability over the age of 75 in the United States with a correlation coefficient (R) of 0.395 and weighted average of 47.1%. Similarly, the statistical analysis conducted on geographies consisting of 118,571,316 people shows a mild positive correlation between the proportion of Immigrants from Uzbekistan and percentage of population with a disability over the age of 75 in the United States with a correlation coefficient (R) of 0.339 and weighted average of 49.2%, a difference of 4.5%.
Disability Age Over 75 Correlation Summary
| Measurement | Arab | Immigrants from Uzbekistan |
| Minimum | 25.0% | 27.0% |
| Maximum | 100.0% | 80.4% |
| Range | 75.0% | 53.5% |
| Mean | 53.5% | 48.4% |
| Median | 47.8% | 48.2% |
| Interquartile 25% (IQ1) | 45.2% | 42.6% |
| Interquartile 75% (IQ3) | 53.7% | 52.5% |
| Interquartile Range (IQR) | 8.5% | 9.9% |
| Standard Deviation (Sample) | 17.6% | 9.8% |
| Standard Deviation (Population) | 17.4% | 9.7% |
Similar Demographics by Disability Age Over 75
Demographics Similar to Arabs by Disability Age Over 75
In terms of disability age over 75, the demographic groups most similar to Arabs are Bhutanese (47.1%, a difference of 0.020%), Immigrants from Zaire (47.1%, a difference of 0.040%), Immigrants from Belarus (47.1%, a difference of 0.040%), Immigrants from Iran (47.1%, a difference of 0.040%), and Immigrants from Guyana (47.1%, a difference of 0.040%).
| Demographics | Rating | Rank | Disability Age Over 75 |
| Welsh | 81.3 /100 | #149 | Excellent 47.0% |
| Immigrants | Russia | 79.3 /100 | #150 | Good 47.0% |
| French Canadians | 79.0 /100 | #151 | Good 47.0% |
| Immigrants | Asia | 76.5 /100 | #152 | Good 47.0% |
| Immigrants | Zaire | 74.8 /100 | #153 | Good 47.1% |
| Immigrants | Belarus | 74.8 /100 | #154 | Good 47.1% |
| Immigrants | Iran | 74.7 /100 | #155 | Good 47.1% |
| Arabs | 73.3 /100 | #156 | Good 47.1% |
| Bhutanese | 72.6 /100 | #157 | Good 47.1% |
| Immigrants | Guyana | 71.9 /100 | #158 | Good 47.1% |
| Immigrants | Morocco | 71.4 /100 | #159 | Good 47.1% |
| Immigrants | Middle Africa | 68.3 /100 | #160 | Good 47.1% |
| South American Indians | 68.1 /100 | #161 | Good 47.1% |
| Pennsylvania Germans | 66.0 /100 | #162 | Good 47.2% |
| Immigrants | Eastern Africa | 65.5 /100 | #163 | Good 47.2% |
Demographics Similar to Immigrants from Uzbekistan by Disability Age Over 75
In terms of disability age over 75, the demographic groups most similar to Immigrants from Uzbekistan are Hawaiian (49.2%, a difference of 0.020%), Immigrants from Laos (49.2%, a difference of 0.060%), Immigrants from Dominica (49.1%, a difference of 0.12%), Immigrants from Guatemala (49.1%, a difference of 0.13%), and Immigrants from Iraq (49.1%, a difference of 0.20%).
| Demographics | Rating | Rank | Disability Age Over 75 |
| Immigrants | El Salvador | 0.2 /100 | #269 | Tragic 49.0% |
| Potawatomi | 0.2 /100 | #270 | Tragic 49.0% |
| Fijians | 0.2 /100 | #271 | Tragic 49.0% |
| Assyrians/Chaldeans/Syriacs | 0.2 /100 | #272 | Tragic 49.1% |
| Immigrants | Iraq | 0.1 /100 | #273 | Tragic 49.1% |
| Immigrants | Guatemala | 0.1 /100 | #274 | Tragic 49.1% |
| Immigrants | Dominica | 0.1 /100 | #275 | Tragic 49.1% |
| Immigrants | Uzbekistan | 0.1 /100 | #276 | Tragic 49.2% |
| Hawaiians | 0.1 /100 | #277 | Tragic 49.2% |
| Immigrants | Laos | 0.1 /100 | #278 | Tragic 49.2% |
| Guamanians/Chamorros | 0.0 /100 | #279 | Tragic 49.4% |
| Bangladeshis | 0.0 /100 | #280 | Tragic 49.4% |
| Belizeans | 0.0 /100 | #281 | Tragic 49.4% |
| Blacks/African Americans | 0.0 /100 | #282 | Tragic 49.5% |
| Samoans | 0.0 /100 | #283 | Tragic 49.5% |