Yup'ik vs Immigrants from Liberia Disability Age Over 75
COMPARE
Yup'ik
Immigrants from Liberia
Disability Age Over 75
Disability Age Over 75 Comparison
Yup'ik
Immigrants from Liberia
61.1%
DISABILITY AGE OVER 75
0.0/ 100
METRIC RATING
347th/ 347
METRIC RANK
48.1%
DISABILITY AGE OVER 75
5.9/ 100
METRIC RATING
228th/ 347
METRIC RANK
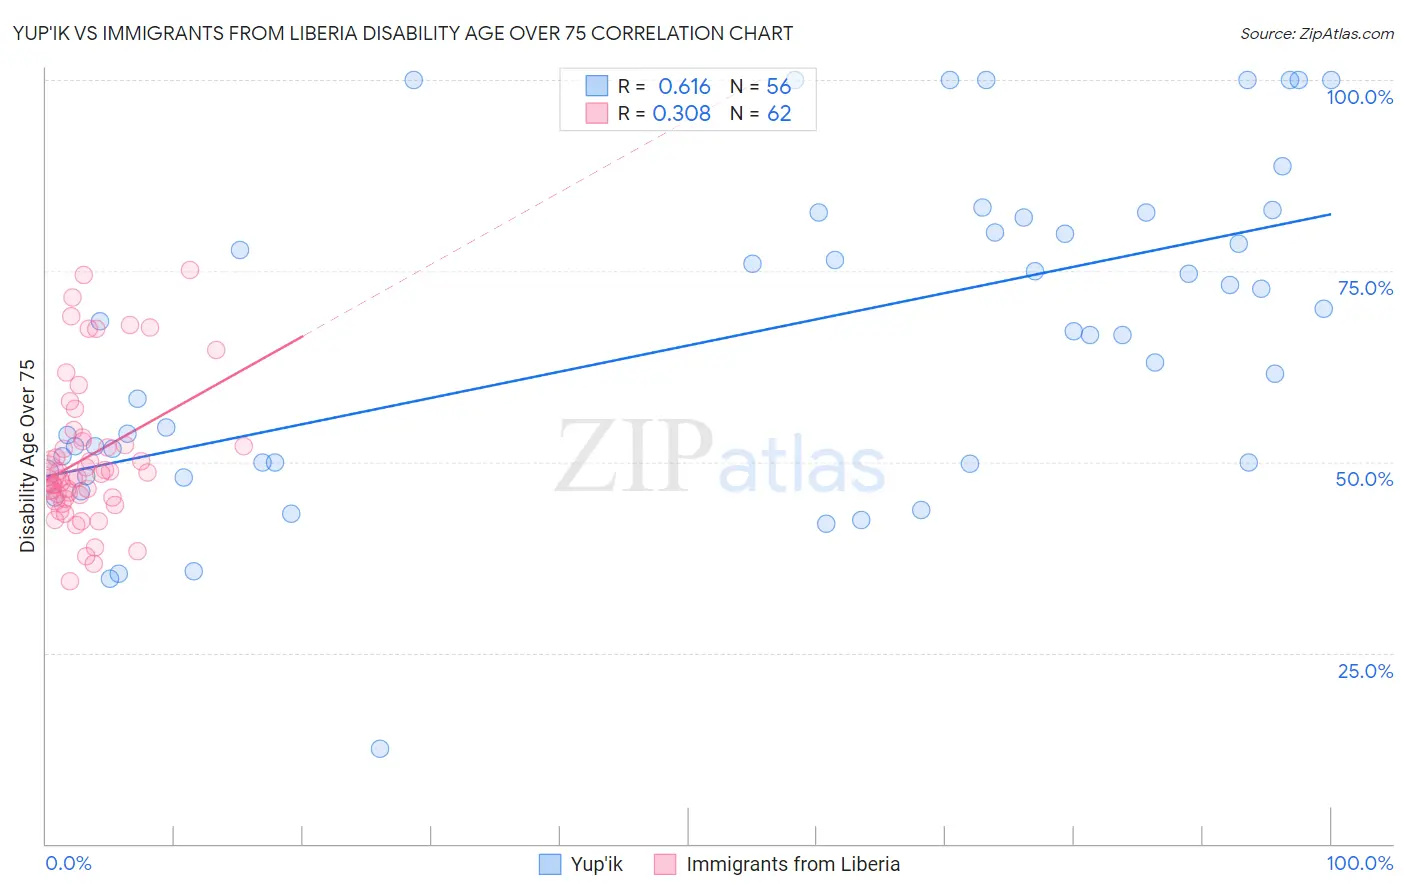
Yup'ik vs Immigrants from Liberia Disability Age Over 75 Correlation Chart
The statistical analysis conducted on geographies consisting of 39,925,791 people shows a significant positive correlation between the proportion of Yup'ik and percentage of population with a disability over the age of 75 in the United States with a correlation coefficient (R) of 0.616 and weighted average of 61.1%. Similarly, the statistical analysis conducted on geographies consisting of 135,085,224 people shows a mild positive correlation between the proportion of Immigrants from Liberia and percentage of population with a disability over the age of 75 in the United States with a correlation coefficient (R) of 0.308 and weighted average of 48.1%, a difference of 27.1%.
Disability Age Over 75 Correlation Summary
| Measurement | Yup'ik | Immigrants from Liberia |
| Minimum | 12.5% | 34.4% |
| Maximum | 100.0% | 75.1% |
| Range | 87.5% | 40.7% |
| Mean | 65.7% | 50.7% |
| Median | 66.7% | 48.2% |
| Interquartile 25% (IQ1) | 49.8% | 45.3% |
| Interquartile 75% (IQ3) | 81.0% | 52.7% |
| Interquartile Range (IQR) | 31.2% | 7.4% |
| Standard Deviation (Sample) | 21.0% | 9.4% |
| Standard Deviation (Population) | 20.8% | 9.3% |
Similar Demographics by Disability Age Over 75
Demographics Similar to Yup'ik by Disability Age Over 75
In terms of disability age over 75, the demographic groups most similar to Yup'ik are Tsimshian (59.2%, a difference of 3.2%), Inupiat (58.4%, a difference of 4.6%), Navajo (58.3%, a difference of 4.9%), Tohono O'odham (56.7%, a difference of 7.7%), and Lumbee (56.2%, a difference of 8.6%).
| Demographics | Rating | Rank | Disability Age Over 75 |
| Apache | 0.0 /100 | #333 | Tragic 53.6% |
| Alaskan Athabascans | 0.0 /100 | #334 | Tragic 54.0% |
| Kiowa | 0.0 /100 | #335 | Tragic 54.2% |
| Immigrants | Armenia | 0.0 /100 | #336 | Tragic 54.3% |
| Yuman | 0.0 /100 | #337 | Tragic 54.4% |
| Colville | 0.0 /100 | #338 | Tragic 55.4% |
| Pima | 0.0 /100 | #339 | Tragic 55.8% |
| Pueblo | 0.0 /100 | #340 | Tragic 55.9% |
| Houma | 0.0 /100 | #341 | Tragic 56.2% |
| Lumbee | 0.0 /100 | #342 | Tragic 56.2% |
| Tohono O'odham | 0.0 /100 | #343 | Tragic 56.7% |
| Navajo | 0.0 /100 | #344 | Tragic 58.3% |
| Inupiat | 0.0 /100 | #345 | Tragic 58.4% |
| Tsimshian | 0.0 /100 | #346 | Tragic 59.2% |
| Yup'ik | 0.0 /100 | #347 | Tragic 61.1% |
Demographics Similar to Immigrants from Liberia by Disability Age Over 75
In terms of disability age over 75, the demographic groups most similar to Immigrants from Liberia are Spaniard (48.1%, a difference of 0.020%), Zimbabwean (48.1%, a difference of 0.040%), Nonimmigrants (48.0%, a difference of 0.050%), Spanish (48.0%, a difference of 0.060%), and Liberian (48.0%, a difference of 0.070%).
| Demographics | Rating | Rank | Disability Age Over 75 |
| Immigrants | Oceania | 7.3 /100 | #221 | Tragic 48.0% |
| Barbadians | 6.8 /100 | #222 | Tragic 48.0% |
| Immigrants | Bangladesh | 6.8 /100 | #223 | Tragic 48.0% |
| Liberians | 6.7 /100 | #224 | Tragic 48.0% |
| Spanish | 6.5 /100 | #225 | Tragic 48.0% |
| Immigrants | Nonimmigrants | 6.5 /100 | #226 | Tragic 48.0% |
| Zimbabweans | 6.4 /100 | #227 | Tragic 48.1% |
| Immigrants | Liberia | 5.9 /100 | #228 | Tragic 48.1% |
| Spaniards | 5.7 /100 | #229 | Tragic 48.1% |
| Taiwanese | 4.4 /100 | #230 | Tragic 48.2% |
| Immigrants | Immigrants | 4.3 /100 | #231 | Tragic 48.2% |
| Indonesians | 4.2 /100 | #232 | Tragic 48.2% |
| Cree | 4.2 /100 | #233 | Tragic 48.2% |
| Sub-Saharan Africans | 3.8 /100 | #234 | Tragic 48.2% |
| Hmong | 3.8 /100 | #235 | Tragic 48.2% |