Immigrants from El Salvador vs Immigrants from Uzbekistan Disability Age Over 75
COMPARE
Immigrants from El Salvador
Immigrants from Uzbekistan
Disability Age Over 75
Disability Age Over 75 Comparison
Immigrants from El Salvador
Immigrants from Uzbekistan
49.0%
DISABILITY AGE OVER 75
0.2/ 100
METRIC RATING
269th/ 347
METRIC RANK
49.2%
DISABILITY AGE OVER 75
0.1/ 100
METRIC RATING
276th/ 347
METRIC RANK
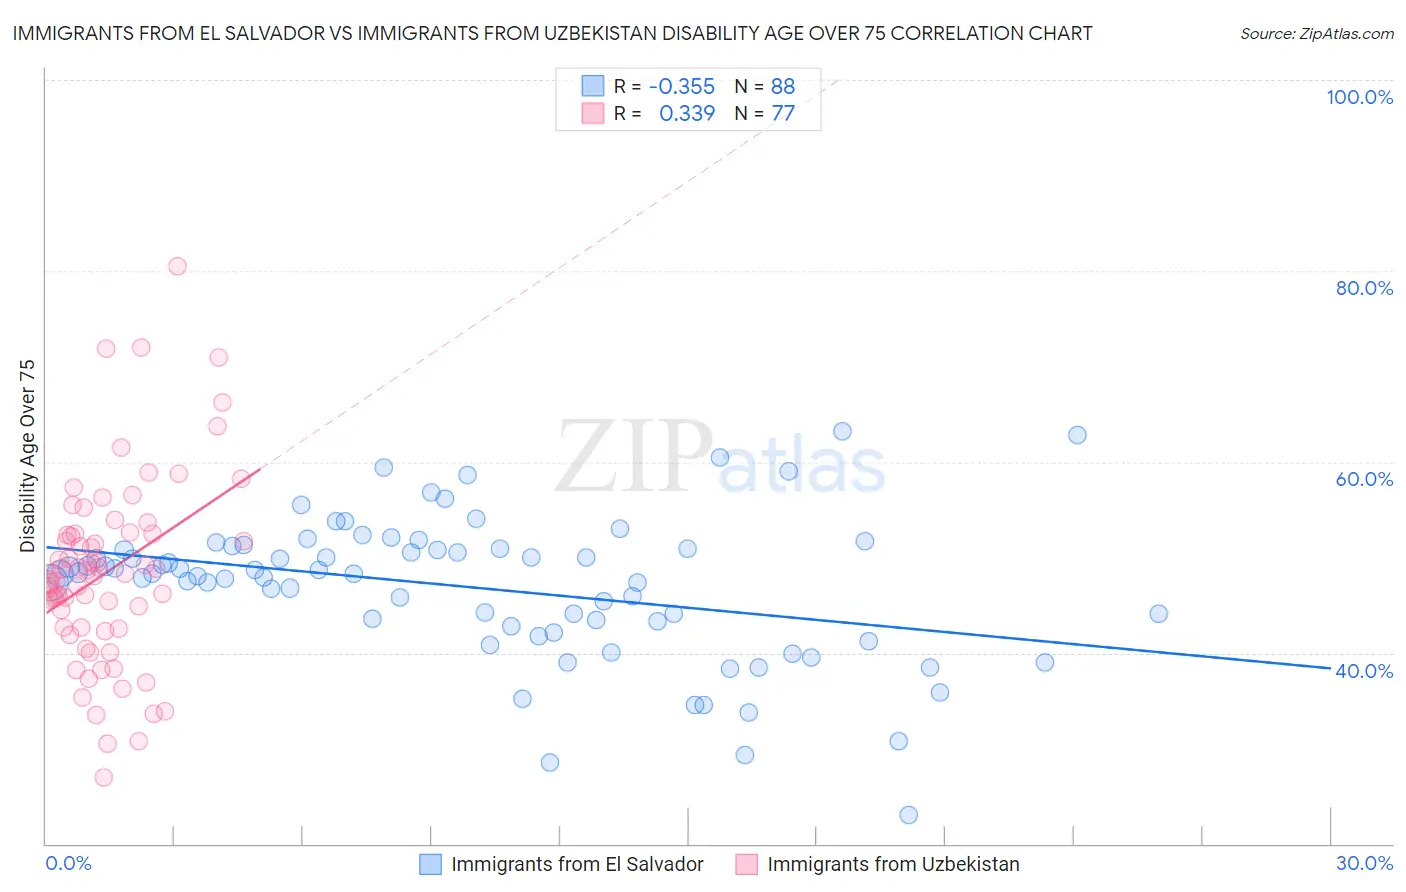
Immigrants from El Salvador vs Immigrants from Uzbekistan Disability Age Over 75 Correlation Chart
The statistical analysis conducted on geographies consisting of 357,354,548 people shows a mild negative correlation between the proportion of Immigrants from El Salvador and percentage of population with a disability over the age of 75 in the United States with a correlation coefficient (R) of -0.355 and weighted average of 49.0%. Similarly, the statistical analysis conducted on geographies consisting of 118,571,316 people shows a mild positive correlation between the proportion of Immigrants from Uzbekistan and percentage of population with a disability over the age of 75 in the United States with a correlation coefficient (R) of 0.339 and weighted average of 49.2%, a difference of 0.31%.
Disability Age Over 75 Correlation Summary
| Measurement | Immigrants from El Salvador | Immigrants from Uzbekistan |
| Minimum | 23.1% | 27.0% |
| Maximum | 63.2% | 80.4% |
| Range | 40.1% | 53.5% |
| Mean | 46.9% | 48.4% |
| Median | 48.3% | 48.2% |
| Interquartile 25% (IQ1) | 43.0% | 42.6% |
| Interquartile 75% (IQ3) | 50.9% | 52.5% |
| Interquartile Range (IQR) | 7.9% | 9.9% |
| Standard Deviation (Sample) | 7.5% | 9.8% |
| Standard Deviation (Population) | 7.4% | 9.7% |
Demographics Similar to Immigrants from El Salvador and Immigrants from Uzbekistan by Disability Age Over 75
In terms of disability age over 75, the demographic groups most similar to Immigrants from El Salvador are Guatemalan (49.0%, a difference of 0.020%), Potawatomi (49.0%, a difference of 0.030%), Malaysian (49.0%, a difference of 0.040%), Fijian (49.0%, a difference of 0.050%), and Assyrian/Chaldean/Syriac (49.1%, a difference of 0.060%). Similarly, the demographic groups most similar to Immigrants from Uzbekistan are Hawaiian (49.2%, a difference of 0.020%), Immigrants from Laos (49.2%, a difference of 0.060%), Immigrants from Dominica (49.1%, a difference of 0.12%), Immigrants from Guatemala (49.1%, a difference of 0.13%), and Immigrants from Iraq (49.1%, a difference of 0.20%).
| Demographics | Rating | Rank | Disability Age Over 75 |
| Immigrants | West Indies | 0.3 /100 | #262 | Tragic 48.9% |
| Salvadorans | 0.3 /100 | #263 | Tragic 48.9% |
| Immigrants | Honduras | 0.3 /100 | #264 | Tragic 48.9% |
| Hondurans | 0.3 /100 | #265 | Tragic 48.9% |
| U.S. Virgin Islanders | 0.2 /100 | #266 | Tragic 48.9% |
| Malaysians | 0.2 /100 | #267 | Tragic 49.0% |
| Guatemalans | 0.2 /100 | #268 | Tragic 49.0% |
| Immigrants | El Salvador | 0.2 /100 | #269 | Tragic 49.0% |
| Potawatomi | 0.2 /100 | #270 | Tragic 49.0% |
| Fijians | 0.2 /100 | #271 | Tragic 49.0% |
| Assyrians/Chaldeans/Syriacs | 0.2 /100 | #272 | Tragic 49.1% |
| Immigrants | Iraq | 0.1 /100 | #273 | Tragic 49.1% |
| Immigrants | Guatemala | 0.1 /100 | #274 | Tragic 49.1% |
| Immigrants | Dominica | 0.1 /100 | #275 | Tragic 49.1% |
| Immigrants | Uzbekistan | 0.1 /100 | #276 | Tragic 49.2% |
| Hawaiians | 0.1 /100 | #277 | Tragic 49.2% |
| Immigrants | Laos | 0.1 /100 | #278 | Tragic 49.2% |
| Guamanians/Chamorros | 0.0 /100 | #279 | Tragic 49.4% |
| Bangladeshis | 0.0 /100 | #280 | Tragic 49.4% |
| Belizeans | 0.0 /100 | #281 | Tragic 49.4% |
| Blacks/African Americans | 0.0 /100 | #282 | Tragic 49.5% |