Yup'ik vs Immigrants from Uzbekistan Child Poverty Among Boys Under 16

COMPARE

Yup'ik
Race
Ancestry
AfghanAfricanAlaska NativeAlaskan AthabascanAlbanianAleutAlsatianAmericanApacheArabArapahoArgentineanArmenianAssyrian/Chaldean/SyriacAustralianAustrianBahamianBangladeshiBarbadianBasqueBelgianBelizeanBermudanBhutaneseBlackfeetBolivianBrazilianBritishBritish West IndianBulgarianBurmeseCajunCambodianCanadianCape VerdeanCarpatho RusynCelticCentral AmericanCentral American IndianCherokeeCheyenneChickasawChileanChineseChippewaChoctawColombianColvilleComancheCosta RicanCreeCreekCroatianCrowCubanCypriotCzechCzechoslovakianDanishDelawareDominicanDutchDutch West IndianEastern EuropeanEcuadorianEgyptianEnglishEstonianEthiopianEuropeanFijianFilipinoFinnishFrenchFrench American IndianFrench CanadianGermanGerman RussianGhanaianGreekGuamanian/ChamorroGuatemalanGuyaneseHaitianHmongHonduranHopiHoumaHungarianIcelanderIndian (Asian)IndonesianInupiatIranianIraqiIrishIroquoisIsraeliItalianJamaicanJapaneseJordanianKenyanKiowaKoreanLaotianLatvianLebaneseLiberianLithuanianLumbeeLuxembourgerMacedonianMalaysianMalteseMarshalleseMenomineeMexicanMexican American IndianMongolianMoroccanNative HawaiianNavajoNepaleseNew ZealanderNicaraguanNigerianNorthern EuropeanNorwegianOkinawanOsageOttawaPaiutePakistaniPalestinianPanamanianParaguayanPennsylvania GermanPeruvianPimaPolishPortuguesePotawatomiPuebloPuerto RicanPuget Sound SalishRomanianRussianSalvadoranSamoanScandinavianScotch-IrishScottishSeminoleSenegaleseSerbianShoshoneSierra LeoneanSiouxSlavicSlovakSloveneSomaliSouth AfricanSouth AmericanSouth American IndianSoviet UnionSpaniardSpanishSpanish AmericanSpanish American IndianSri LankanSubsaharan AfricanSudaneseSwedishSwissSyrianTaiwaneseThaiTlingit-HaidaTohono O'OdhamTonganTrinidadian and TobagonianTsimshianTurkishU.S. Virgin IslanderUgandanUkrainianUruguayanUteVenezuelanVietnameseWelshWest IndianYakamaYaquiYugoslavianYumanYup'ikZimbabwean
Immigration
NonimmigrantsImmigrantsAfghanistanAfricaAlbaniaArgentinaArmeniaAsiaAustraliaAustriaBahamasBangladeshBarbadosBelarusBelgiumBelizeBoliviaBosnia and HerzegovinaBrazilBulgariaBurma/MyanmarCabo VerdeCambodiaCameroonCanadaCaribbeanCentral AmericaChileChinaColombiaCongoCosta RicaCroatiaCubaCzechoslovakiaDenmarkDominicaDominican RepublicEastern AfricaEastern AsiaEastern EuropeEcuadorEgyptEl SalvadorEnglandEritreaEthiopiaEuropeFijiFranceGermanyGhanaGreeceGrenadaGuatemalaGuyanaHaitiHondurasHong KongHungaryIndiaIndonesiaIranIraqIrelandIsraelItalyJamaicaJapanJordanKazakhstanKenyaKoreaKuwaitLaosLatin AmericaLatviaLebanonLiberiaLithuaniaMalaysiaMexicoMicronesiaMiddle AfricaMoldovaMoroccoNepalNetherlandsNicaraguaNigeriaNorth AmericaNorth MacedoniaNorthern AfricaNorthern EuropeNorwayOceaniaPakistanPanamaPeruPhilippinesPolandPortugalRomaniaRussiaSaudi ArabiaScotlandSenegalSerbiaSierra LeoneSingaporeSomaliaSouth AfricaSouth AmericaSouth Central AsiaSouth Eastern AsiaSouthern EuropeSpainSri LankaSt. Vincent and the GrenadinesSudanSwedenSwitzerlandSyriaTaiwanThailandTrinidad and TobagoTurkeyUgandaUkraineUruguayVenezuelaVietnamWest IndiesWestern AfricaWestern AsiaWestern EuropeYemenZaireZimbabweAzores
Immigrants from Uzbekistan
Race
Ancestry
AfghanAfricanAlaska NativeAlaskan AthabascanAlbanianAleutAlsatianAmericanApacheArabArapahoArgentineanArmenianAssyrian/Chaldean/SyriacAustralianAustrianBahamianBangladeshiBarbadianBasqueBelgianBelizeanBermudanBhutaneseBlackfeetBolivianBrazilianBritishBritish West IndianBulgarianBurmeseCajunCambodianCanadianCape VerdeanCarpatho RusynCelticCentral AmericanCentral American IndianCherokeeCheyenneChickasawChileanChineseChippewaChoctawColombianColvilleComancheCosta RicanCreeCreekCroatianCrowCubanCypriotCzechCzechoslovakianDanishDelawareDominicanDutchDutch West IndianEastern EuropeanEcuadorianEgyptianEnglishEstonianEthiopianEuropeanFijianFilipinoFinnishFrenchFrench American IndianFrench CanadianGermanGerman RussianGhanaianGreekGuamanian/ChamorroGuatemalanGuyaneseHaitianHmongHonduranHopiHoumaHungarianIcelanderIndian (Asian)IndonesianInupiatIranianIraqiIrishIroquoisIsraeliItalianJamaicanJapaneseJordanianKenyanKiowaKoreanLaotianLatvianLebaneseLiberianLithuanianLumbeeLuxembourgerMacedonianMalaysianMalteseMarshalleseMenomineeMexicanMexican American IndianMongolianMoroccanNative HawaiianNavajoNepaleseNew ZealanderNicaraguanNigerianNorthern EuropeanNorwegianOkinawanOsageOttawaPaiutePakistaniPalestinianPanamanianParaguayanPennsylvania GermanPeruvianPimaPolishPortuguesePotawatomiPuebloPuerto RicanPuget Sound SalishRomanianRussianSalvadoranSamoanScandinavianScotch-IrishScottishSeminoleSenegaleseSerbianShoshoneSierra LeoneanSiouxSlavicSlovakSloveneSomaliSouth AfricanSouth AmericanSouth American IndianSoviet UnionSpaniardSpanishSpanish AmericanSpanish American IndianSri LankanSubsaharan AfricanSudaneseSwedishSwissSyrianTaiwaneseThaiTlingit-HaidaTohono O'OdhamTonganTrinidadian and TobagonianTsimshianTurkishU.S. Virgin IslanderUgandanUkrainianUruguayanUteVenezuelanVietnameseWelshWest IndianYakamaYaquiYugoslavianYumanZimbabwean
Immigration
NonimmigrantsImmigrantsAfghanistanAfricaAlbaniaArgentinaArmeniaAsiaAustraliaAustriaBahamasBangladeshBarbadosBelarusBelgiumBelizeBoliviaBosnia and HerzegovinaBrazilBulgariaBurma/MyanmarCabo VerdeCambodiaCameroonCanadaCaribbeanCentral AmericaChileChinaColombiaCongoCosta RicaCroatiaCubaCzechoslovakiaDenmarkDominicaDominican RepublicEastern AfricaEastern AsiaEastern EuropeEcuadorEgyptEl SalvadorEnglandEritreaEthiopiaEuropeFijiFranceGermanyGhanaGreeceGrenadaGuatemalaGuyanaHaitiHondurasHong KongHungaryIndiaIndonesiaIranIraqIrelandIsraelItalyJamaicaJapanJordanKazakhstanKenyaKoreaKuwaitLaosLatin AmericaLatviaLebanonLiberiaLithuaniaMalaysiaMexicoMicronesiaMiddle AfricaMoldovaMoroccoNepalNetherlandsNicaraguaNigeriaNorth AmericaNorth MacedoniaNorthern AfricaNorthern EuropeNorwayOceaniaPakistanPanamaPeruPhilippinesPolandPortugalRomaniaRussiaSaudi ArabiaScotlandSenegalSerbiaSierra LeoneSingaporeSomaliaSouth AfricaSouth AmericaSouth Central AsiaSouth Eastern AsiaSouthern EuropeSpainSri LankaSt. Vincent and the GrenadinesSudanSwedenSwitzerlandSyriaTaiwanThailandTrinidad and TobagoTurkeyUgandaUkraineUruguayUzbekistanVenezuelaVietnamWest IndiesWestern AfricaWestern AsiaWestern EuropeYemenZaireZimbabweAzores
Child Poverty Among Boys Under 16
Income
Poverty
Unemployment
Labor Participation
Family Structure
Vehicle Availability
Education Level
Disability

Child Poverty Among Boys Under 16 Comparison

Yup'ik

Immigrants from Uzbekistan

Tragic
Poor
24.7%
CHILD POVERTY AMONG BOYS UNDER 16
0.0/ 100
METRIC RATING
335th/ 347
METRIC RANK
17.3%
CHILD POVERTY AMONG BOYS UNDER 16
13.3/ 100
METRIC RATING
203rd/ 347
METRIC RANK

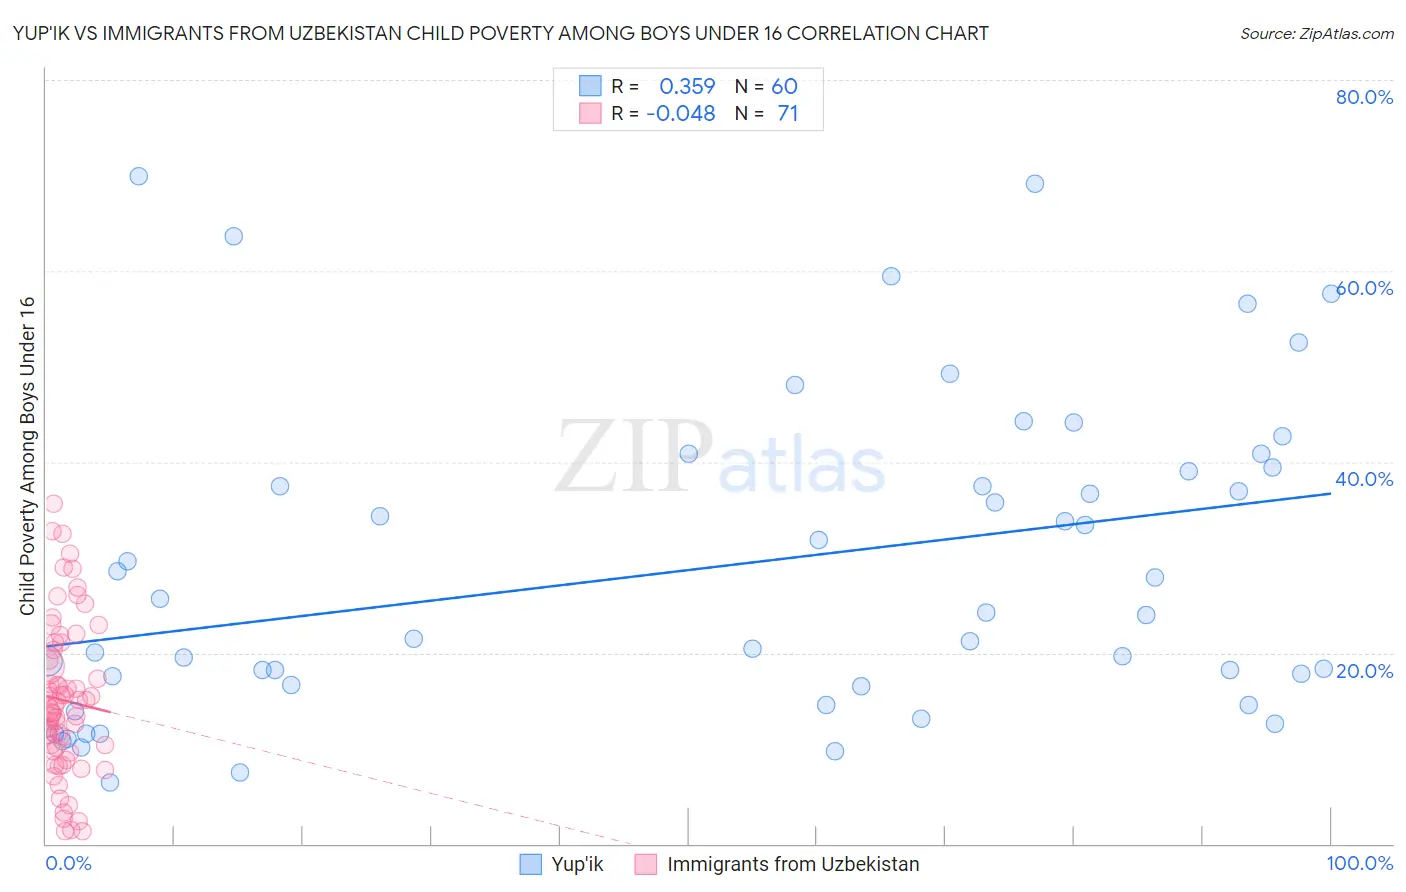
Yup'ik vs Immigrants from Uzbekistan Child Poverty Among Boys Under 16 Correlation Chart

The statistical analysis conducted on geographies consisting of 39,797,465 people shows a mild positive correlation between the proportion of Yup'ik and poverty level among boys under the age of 16 in the United States with a correlation coefficient (R) of 0.359 and weighted average of 24.7%. Similarly, the statistical analysis conducted on geographies consisting of 117,928,505 people shows no correlation between the proportion of Immigrants from Uzbekistan and poverty level among boys under the age of 16 in the United States with a correlation coefficient (R) of -0.048 and weighted average of 17.3%, a difference of 43.0%.
Yup'ik vs Immigrants from Uzbekistan Child Poverty Among Boys Under 16

Child Poverty Among Boys Under 16 Correlation Summary

MeasurementYup'ikImmigrants from Uzbekistan
Minimum6.4%1.3%
Maximum69.9%35.6%
Range63.5%34.3%
Mean28.9%15.0%
Median24.1%14.0%
Interquartile 25% (IQ1)16.6%9.7%
Interquartile 75% (IQ3)39.2%20.3%
Interquartile Range (IQR)22.6%10.7%
Standard Deviation (Sample)16.4%8.0%
Standard Deviation (Population)16.3%7.9%

Similar Demographics by Child Poverty Among Boys Under 16

Demographics Similar to Yup'ik by Child Poverty Among Boys Under 16

In terms of child poverty among boys under 16, the demographic groups most similar to Yup'ik are Black/African American (24.5%, a difference of 0.85%), Apache (24.5%, a difference of 0.97%), Immigrants from Dominican Republic (24.3%, a difference of 1.7%), Dominican (24.2%, a difference of 2.3%), and Sioux (25.3%, a difference of 2.3%).
DemographicsRating | RankChild Poverty Among Boys Under 16
Pueblo
0.0
/100
|
#328
Tragic
23.5%
Natives/Alaskans
0.0
/100
|
#329
Tragic
24.0%
Colville
0.0
/100
|
#330
Tragic
24.1%
Dominicans
0.0
/100
|
#331
Tragic
24.2%
Immigrants | Dominican Republic
0.0
/100
|
#332
Tragic
24.3%
Apache
0.0
/100
|
#333
Tragic
24.5%
Blacks/African Americans
0.0
/100
|
#334
Tragic
24.5%
Yup'ik
0.0
/100
|
#335
Tragic
24.7%
Sioux
0.0
/100
|
#336
Tragic
25.3%
Cheyenne
0.0
/100
|
#337
Tragic
25.8%
Hopi
0.0
/100
|
#338
Tragic
25.9%
Houma
0.0
/100
|
#339
Tragic
26.2%
Crow
0.0
/100
|
#340
Tragic
26.3%
Immigrants | Yemen
0.0
/100
|
#341
Tragic
28.9%
Pima
0.0
/100
|
#342
Tragic
29.7%

Demographics Similar to Immigrants from Uzbekistan by Child Poverty Among Boys Under 16

In terms of child poverty among boys under 16, the demographic groups most similar to Immigrants from Uzbekistan are Immigrants from Sierra Leone (17.3%, a difference of 0.020%), Immigrants from Afghanistan (17.3%, a difference of 0.080%), Ugandan (17.3%, a difference of 0.20%), Immigrants from Portugal (17.4%, a difference of 0.53%), and German Russian (17.4%, a difference of 0.59%).
DemographicsRating | RankChild Poverty Among Boys Under 16
Spaniards
20.5
/100
|
#196
Fair
17.1%
Immigrants | Kenya
20.1
/100
|
#197
Fair
17.1%
Immigrants | Cameroon
19.0
/100
|
#198
Poor
17.1%
Delaware
18.8
/100
|
#199
Poor
17.1%
Immigrants | Uruguay
16.9
/100
|
#200
Poor
17.2%
Immigrants | Afghanistan
13.7
/100
|
#201
Poor
17.3%
Immigrants | Sierra Leone
13.4
/100
|
#202
Poor
17.3%
Immigrants | Uzbekistan
13.3
/100
|
#203
Poor
17.3%
Ugandans
12.5
/100
|
#204
Poor
17.3%
Immigrants | Portugal
11.2
/100
|
#205
Poor
17.4%
German Russians
10.9
/100
|
#206
Poor
17.4%
Immigrants | Thailand
8.2
/100
|
#207
Tragic
17.5%
Malaysians
7.6
/100
|
#208
Tragic
17.6%
Alaskan Athabascans
7.3
/100
|
#209
Tragic
17.6%
Immigrants | Armenia
6.8
/100
|
#210
Tragic
17.6%