Yup'ik vs Immigrants from Uzbekistan Unemployment Among Ages 35 to 44 years
COMPARE
Yup'ik
Immigrants from Uzbekistan
Unemployment Among Ages 35 to 44 years
Unemployment Among Ages 35 to 44 years Comparison
Yup'ik
Immigrants from Uzbekistan
14.4%
UNEMPLOYMENT AMONG AGES 35 TO 44 YEARS
0.0/ 100
METRIC RATING
345th/ 347
METRIC RANK
5.0%
UNEMPLOYMENT AMONG AGES 35 TO 44 YEARS
1.9/ 100
METRIC RATING
227th/ 347
METRIC RANK
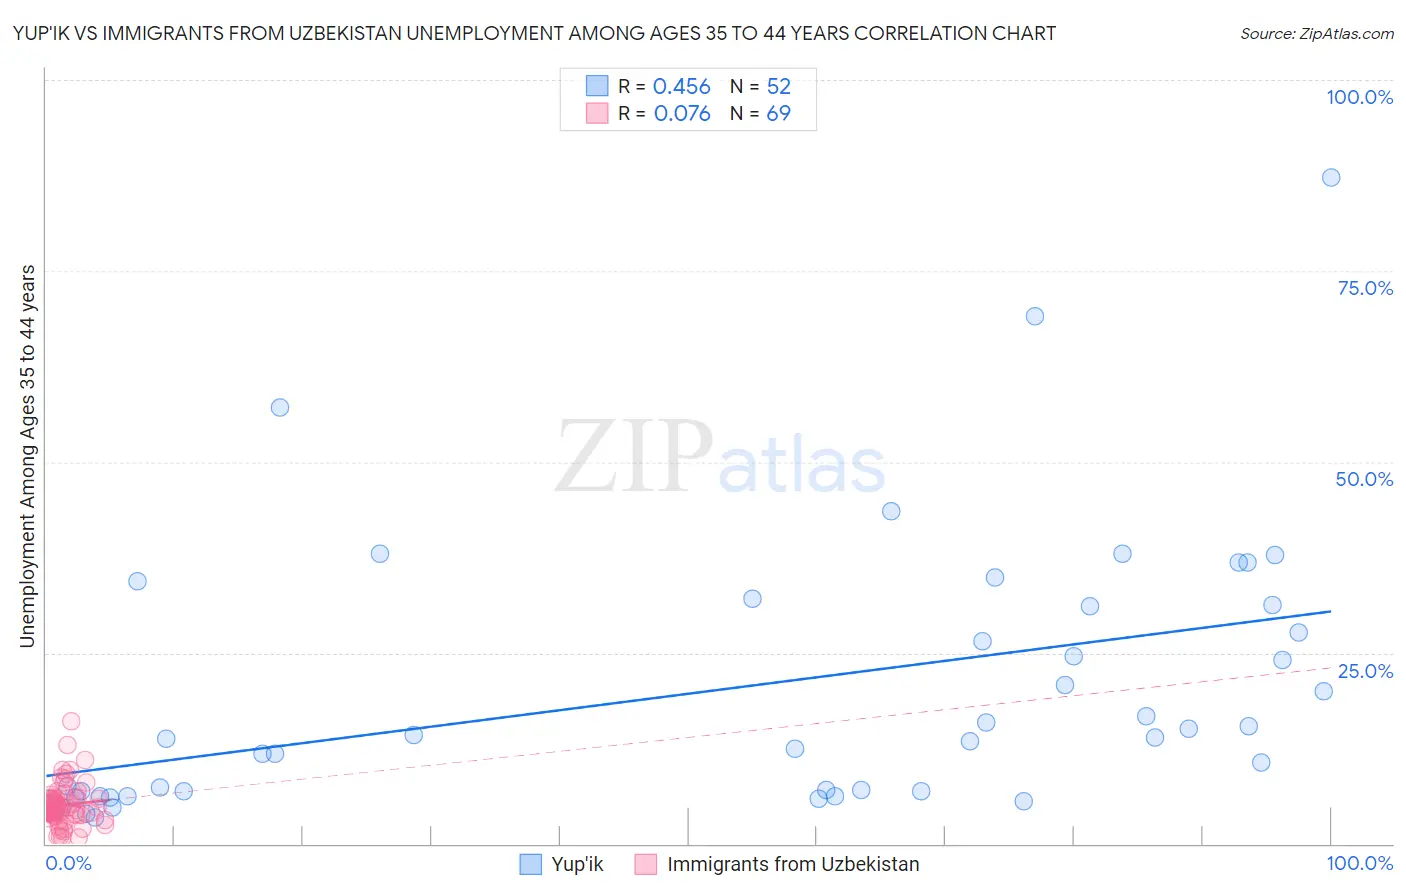
Yup'ik vs Immigrants from Uzbekistan Unemployment Among Ages 35 to 44 years Correlation Chart
The statistical analysis conducted on geographies consisting of 39,745,943 people shows a moderate positive correlation between the proportion of Yup'ik and unemployment rate among population between the ages 35 and 44 in the United States with a correlation coefficient (R) of 0.456 and weighted average of 14.4%. Similarly, the statistical analysis conducted on geographies consisting of 118,056,376 people shows a slight positive correlation between the proportion of Immigrants from Uzbekistan and unemployment rate among population between the ages 35 and 44 in the United States with a correlation coefficient (R) of 0.076 and weighted average of 5.0%, a difference of 187.9%.
Unemployment Among Ages 35 to 44 years Correlation Summary
| Measurement | Yup'ik | Immigrants from Uzbekistan |
| Minimum | 3.5% | 0.90% |
| Maximum | 87.2% | 16.1% |
| Range | 83.8% | 15.2% |
| Mean | 19.9% | 5.1% |
| Median | 13.8% | 4.6% |
| Interquartile 25% (IQ1) | 6.6% | 3.8% |
| Interquartile 75% (IQ3) | 31.2% | 5.9% |
| Interquartile Range (IQR) | 24.6% | 2.1% |
| Standard Deviation (Sample) | 17.6% | 2.7% |
| Standard Deviation (Population) | 17.5% | 2.7% |
Similar Demographics by Unemployment Among Ages 35 to 44 years
Demographics Similar to Yup'ik by Unemployment Among Ages 35 to 44 years
In terms of unemployment among ages 35 to 44 years, the demographic groups most similar to Yup'ik are Crow (15.7%, a difference of 8.8%), Yuman (16.9%, a difference of 17.2%), Pima (11.8%, a difference of 22.8%), Arapaho (10.3%, a difference of 40.3%), and Navajo (9.3%, a difference of 54.6%).
| Demographics | Rating | Rank | Unemployment Among Ages 35 to 44 years |
| Puerto Ricans | 0.0 /100 | #333 | Tragic 7.6% |
| Houma | 0.0 /100 | #334 | Tragic 7.8% |
| Sioux | 0.0 /100 | #335 | Tragic 8.4% |
| Apache | 0.0 /100 | #336 | Tragic 8.4% |
| Tohono O'odham | 0.0 /100 | #337 | Tragic 8.4% |
| Cheyenne | 0.0 /100 | #338 | Tragic 8.5% |
| Inupiat | 0.0 /100 | #339 | Tragic 8.6% |
| Alaskan Athabascans | 0.0 /100 | #340 | Tragic 8.6% |
| Hopi | 0.0 /100 | #341 | Tragic 8.9% |
| Navajo | 0.0 /100 | #342 | Tragic 9.3% |
| Arapaho | 0.0 /100 | #343 | Tragic 10.3% |
| Pima | 0.0 /100 | #344 | Tragic 11.8% |
| Yup'ik | 0.0 /100 | #345 | Tragic 14.4% |
| Crow | 0.0 /100 | #346 | Tragic 15.7% |
| Yuman | 0.0 /100 | #347 | Tragic 16.9% |
Demographics Similar to Immigrants from Uzbekistan by Unemployment Among Ages 35 to 44 years
In terms of unemployment among ages 35 to 44 years, the demographic groups most similar to Immigrants from Uzbekistan are Samoan (5.0%, a difference of 0.15%), Immigrants from Cambodia (5.0%, a difference of 0.43%), Potawatomi (5.0%, a difference of 0.47%), Immigrants from Lebanon (5.0%, a difference of 0.59%), and Panamanian (5.0%, a difference of 0.70%).
| Demographics | Rating | Rank | Unemployment Among Ages 35 to 44 years |
| Immigrants | Sierra Leone | 4.7 /100 | #220 | Tragic 4.9% |
| Bermudans | 3.9 /100 | #221 | Tragic 5.0% |
| Hmong | 3.5 /100 | #222 | Tragic 5.0% |
| Immigrants | Panama | 3.3 /100 | #223 | Tragic 5.0% |
| Panamanians | 2.9 /100 | #224 | Tragic 5.0% |
| Immigrants | Lebanon | 2.7 /100 | #225 | Tragic 5.0% |
| Potawatomi | 2.5 /100 | #226 | Tragic 5.0% |
| Immigrants | Uzbekistan | 1.9 /100 | #227 | Tragic 5.0% |
| Samoans | 1.8 /100 | #228 | Tragic 5.0% |
| Immigrants | Cambodia | 1.5 /100 | #229 | Tragic 5.0% |
| Liberians | 1.3 /100 | #230 | Tragic 5.1% |
| Japanese | 1.2 /100 | #231 | Tragic 5.1% |
| Iroquois | 1.2 /100 | #232 | Tragic 5.1% |
| Immigrants | Nigeria | 1.2 /100 | #233 | Tragic 5.1% |
| Portuguese | 1.1 /100 | #234 | Tragic 5.1% |