Yup'ik vs Menominee Disability Age Over 75
COMPARE
Yup'ik
Menominee
Disability Age Over 75
Disability Age Over 75 Comparison
Yup'ik
Menominee
61.1%
DISABILITY AGE OVER 75
0.0/ 100
METRIC RATING
347th/ 347
METRIC RANK
52.3%
DISABILITY AGE OVER 75
0.0/ 100
METRIC RATING
324th/ 347
METRIC RANK
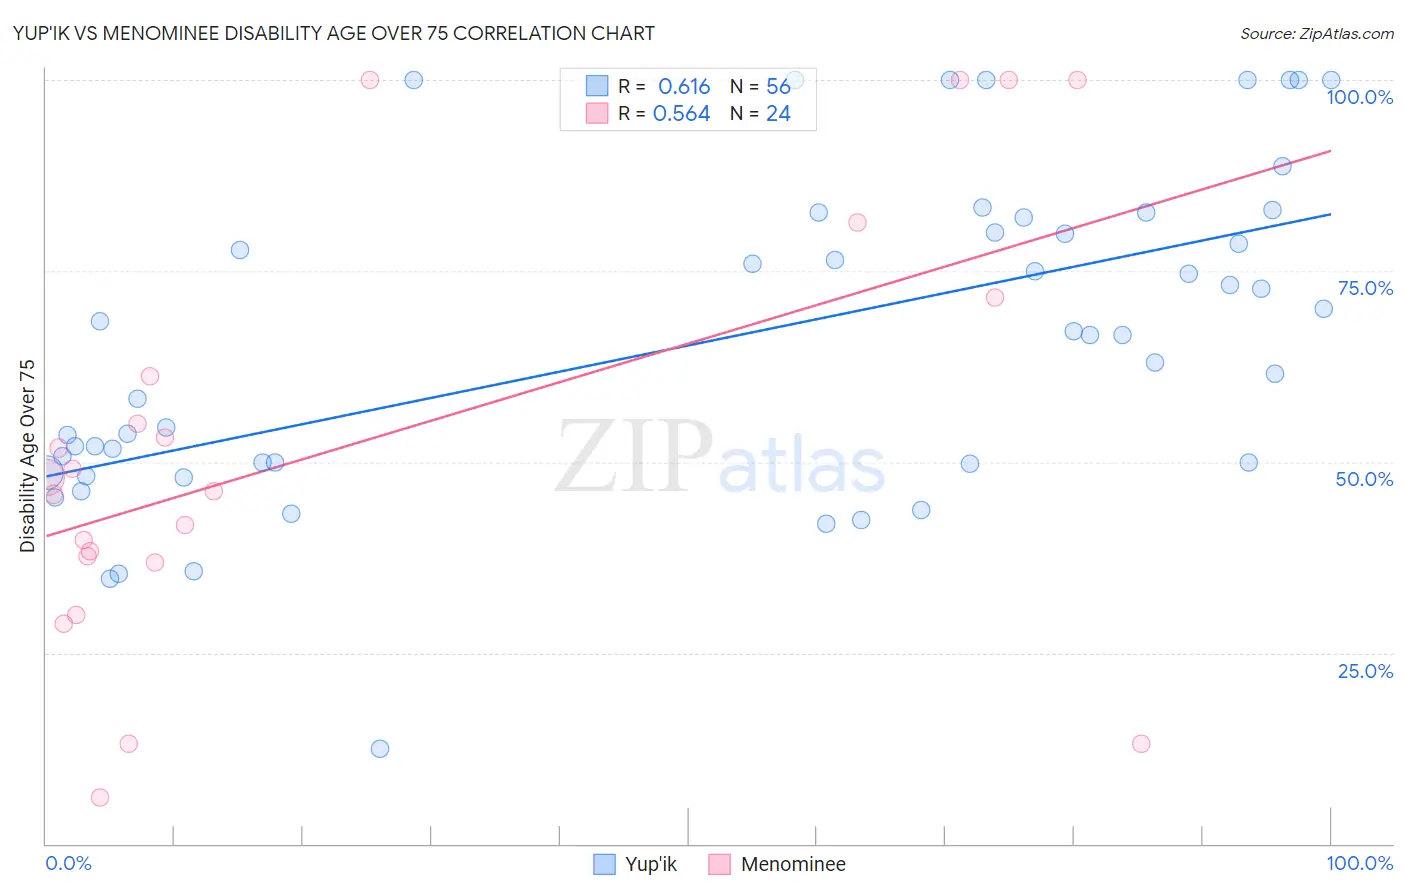
Yup'ik vs Menominee Disability Age Over 75 Correlation Chart
The statistical analysis conducted on geographies consisting of 39,925,791 people shows a significant positive correlation between the proportion of Yup'ik and percentage of population with a disability over the age of 75 in the United States with a correlation coefficient (R) of 0.616 and weighted average of 61.1%. Similarly, the statistical analysis conducted on geographies consisting of 45,777,346 people shows a substantial positive correlation between the proportion of Menominee and percentage of population with a disability over the age of 75 in the United States with a correlation coefficient (R) of 0.564 and weighted average of 52.3%, a difference of 16.9%.
Disability Age Over 75 Correlation Summary
| Measurement | Yup'ik | Menominee |
| Minimum | 12.5% | 6.1% |
| Maximum | 100.0% | 100.0% |
| Range | 87.5% | 93.9% |
| Mean | 65.7% | 52.0% |
| Median | 66.7% | 47.1% |
| Interquartile 25% (IQ1) | 49.8% | 37.2% |
| Interquartile 75% (IQ3) | 81.0% | 66.3% |
| Interquartile Range (IQR) | 31.2% | 29.2% |
| Standard Deviation (Sample) | 21.0% | 27.7% |
| Standard Deviation (Population) | 20.8% | 27.2% |
Similar Demographics by Disability Age Over 75
Demographics Similar to Yup'ik by Disability Age Over 75
In terms of disability age over 75, the demographic groups most similar to Yup'ik are Tsimshian (59.2%, a difference of 3.2%), Inupiat (58.4%, a difference of 4.6%), Navajo (58.3%, a difference of 4.9%), Tohono O'odham (56.7%, a difference of 7.7%), and Lumbee (56.2%, a difference of 8.6%).
| Demographics | Rating | Rank | Disability Age Over 75 |
| Apache | 0.0 /100 | #333 | Tragic 53.6% |
| Alaskan Athabascans | 0.0 /100 | #334 | Tragic 54.0% |
| Kiowa | 0.0 /100 | #335 | Tragic 54.2% |
| Immigrants | Armenia | 0.0 /100 | #336 | Tragic 54.3% |
| Yuman | 0.0 /100 | #337 | Tragic 54.4% |
| Colville | 0.0 /100 | #338 | Tragic 55.4% |
| Pima | 0.0 /100 | #339 | Tragic 55.8% |
| Pueblo | 0.0 /100 | #340 | Tragic 55.9% |
| Houma | 0.0 /100 | #341 | Tragic 56.2% |
| Lumbee | 0.0 /100 | #342 | Tragic 56.2% |
| Tohono O'odham | 0.0 /100 | #343 | Tragic 56.7% |
| Navajo | 0.0 /100 | #344 | Tragic 58.3% |
| Inupiat | 0.0 /100 | #345 | Tragic 58.4% |
| Tsimshian | 0.0 /100 | #346 | Tragic 59.2% |
| Yup'ik | 0.0 /100 | #347 | Tragic 61.1% |
Demographics Similar to Menominee by Disability Age Over 75
In terms of disability age over 75, the demographic groups most similar to Menominee are Immigrants from Cabo Verde (52.4%, a difference of 0.16%), Ute (52.6%, a difference of 0.51%), Nepalese (52.6%, a difference of 0.54%), Immigrants from Yemen (52.0%, a difference of 0.63%), and Choctaw (52.7%, a difference of 0.73%).
| Demographics | Rating | Rank | Disability Age Over 75 |
| Yakama | 0.0 /100 | #317 | Tragic 51.3% |
| Seminole | 0.0 /100 | #318 | Tragic 51.5% |
| Creek | 0.0 /100 | #319 | Tragic 51.5% |
| Paiute | 0.0 /100 | #320 | Tragic 51.5% |
| Dutch West Indians | 0.0 /100 | #321 | Tragic 51.5% |
| Comanche | 0.0 /100 | #322 | Tragic 51.7% |
| Immigrants | Yemen | 0.0 /100 | #323 | Tragic 52.0% |
| Menominee | 0.0 /100 | #324 | Tragic 52.3% |
| Immigrants | Cabo Verde | 0.0 /100 | #325 | Tragic 52.4% |
| Ute | 0.0 /100 | #326 | Tragic 52.6% |
| Nepalese | 0.0 /100 | #327 | Tragic 52.6% |
| Choctaw | 0.0 /100 | #328 | Tragic 52.7% |
| Alaska Natives | 0.0 /100 | #329 | Tragic 52.8% |
| Puerto Ricans | 0.0 /100 | #330 | Tragic 52.9% |
| Hopi | 0.0 /100 | #331 | Tragic 52.9% |