Apache vs Immigrants from Uzbekistan Disability Age Over 75
COMPARE
Apache
Immigrants from Uzbekistan
Disability Age Over 75
Disability Age Over 75 Comparison
Apache
Immigrants from Uzbekistan
53.6%
DISABILITY AGE OVER 75
0.0/ 100
METRIC RATING
333rd/ 347
METRIC RANK
49.2%
DISABILITY AGE OVER 75
0.1/ 100
METRIC RATING
276th/ 347
METRIC RANK
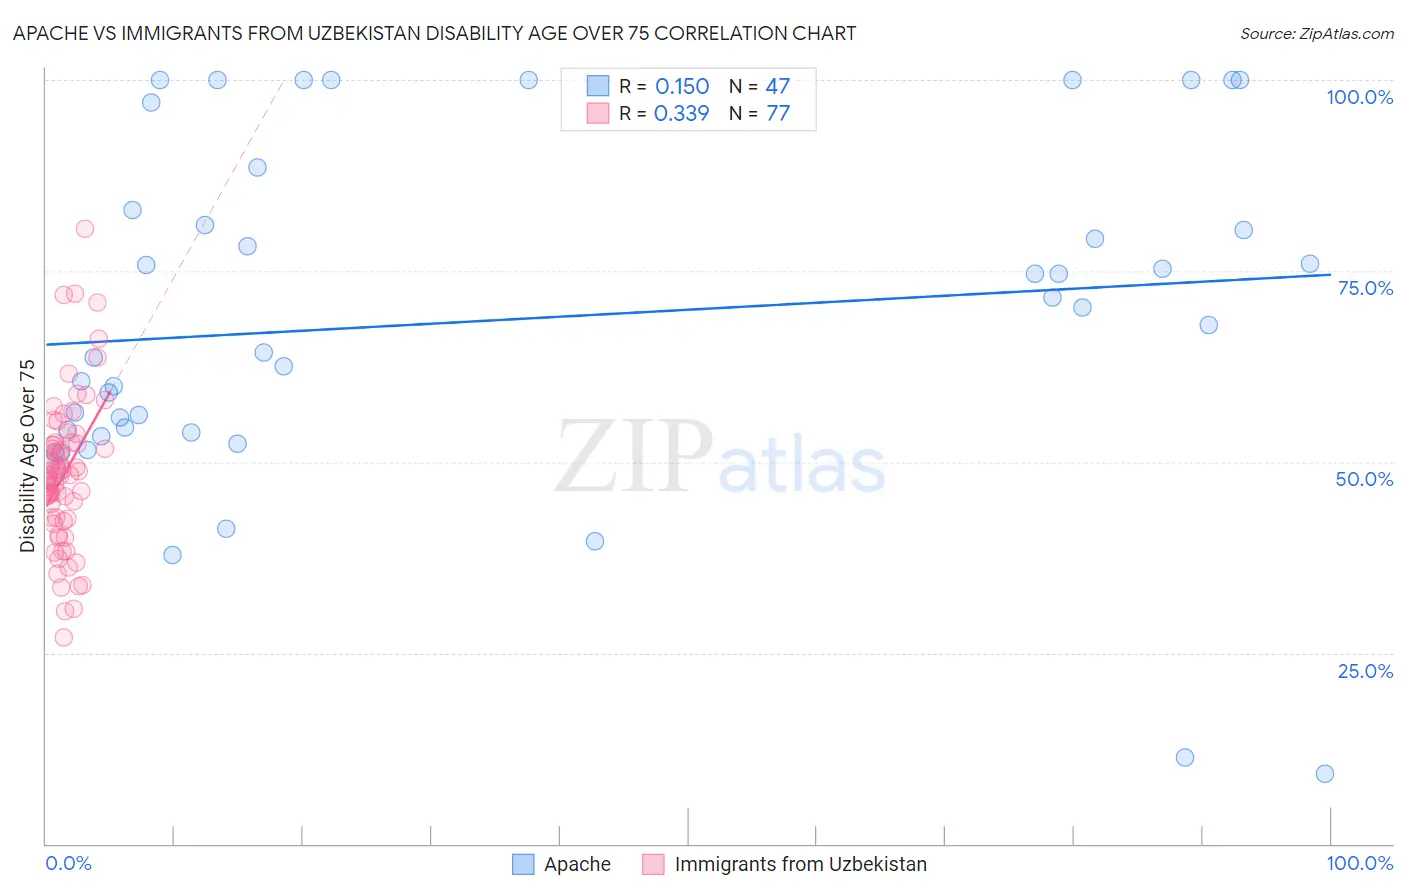
Apache vs Immigrants from Uzbekistan Disability Age Over 75 Correlation Chart
The statistical analysis conducted on geographies consisting of 230,788,811 people shows a poor positive correlation between the proportion of Apache and percentage of population with a disability over the age of 75 in the United States with a correlation coefficient (R) of 0.150 and weighted average of 53.6%. Similarly, the statistical analysis conducted on geographies consisting of 118,571,316 people shows a mild positive correlation between the proportion of Immigrants from Uzbekistan and percentage of population with a disability over the age of 75 in the United States with a correlation coefficient (R) of 0.339 and weighted average of 49.2%, a difference of 9.0%.
Disability Age Over 75 Correlation Summary
| Measurement | Apache | Immigrants from Uzbekistan |
| Minimum | 9.1% | 27.0% |
| Maximum | 100.0% | 80.4% |
| Range | 90.9% | 53.5% |
| Mean | 68.6% | 48.4% |
| Median | 68.0% | 48.2% |
| Interquartile 25% (IQ1) | 53.8% | 42.6% |
| Interquartile 75% (IQ3) | 83.0% | 52.5% |
| Interquartile Range (IQR) | 29.2% | 9.9% |
| Standard Deviation (Sample) | 22.6% | 9.8% |
| Standard Deviation (Population) | 22.4% | 9.7% |
Similar Demographics by Disability Age Over 75
Demographics Similar to Apache by Disability Age Over 75
In terms of disability age over 75, the demographic groups most similar to Apache are Alaskan Athabascan (54.0%, a difference of 0.67%), Native/Alaskan (53.1%, a difference of 1.0%), Kiowa (54.2%, a difference of 1.2%), Hopi (52.9%, a difference of 1.3%), and Puerto Rican (52.9%, a difference of 1.3%).
| Demographics | Rating | Rank | Disability Age Over 75 |
| Ute | 0.0 /100 | #326 | Tragic 52.6% |
| Nepalese | 0.0 /100 | #327 | Tragic 52.6% |
| Choctaw | 0.0 /100 | #328 | Tragic 52.7% |
| Alaska Natives | 0.0 /100 | #329 | Tragic 52.8% |
| Puerto Ricans | 0.0 /100 | #330 | Tragic 52.9% |
| Hopi | 0.0 /100 | #331 | Tragic 52.9% |
| Natives/Alaskans | 0.0 /100 | #332 | Tragic 53.1% |
| Apache | 0.0 /100 | #333 | Tragic 53.6% |
| Alaskan Athabascans | 0.0 /100 | #334 | Tragic 54.0% |
| Kiowa | 0.0 /100 | #335 | Tragic 54.2% |
| Immigrants | Armenia | 0.0 /100 | #336 | Tragic 54.3% |
| Yuman | 0.0 /100 | #337 | Tragic 54.4% |
| Colville | 0.0 /100 | #338 | Tragic 55.4% |
| Pima | 0.0 /100 | #339 | Tragic 55.8% |
| Pueblo | 0.0 /100 | #340 | Tragic 55.9% |
Demographics Similar to Immigrants from Uzbekistan by Disability Age Over 75
In terms of disability age over 75, the demographic groups most similar to Immigrants from Uzbekistan are Hawaiian (49.2%, a difference of 0.020%), Immigrants from Laos (49.2%, a difference of 0.060%), Immigrants from Dominica (49.1%, a difference of 0.12%), Immigrants from Guatemala (49.1%, a difference of 0.13%), and Immigrants from Iraq (49.1%, a difference of 0.20%).
| Demographics | Rating | Rank | Disability Age Over 75 |
| Immigrants | El Salvador | 0.2 /100 | #269 | Tragic 49.0% |
| Potawatomi | 0.2 /100 | #270 | Tragic 49.0% |
| Fijians | 0.2 /100 | #271 | Tragic 49.0% |
| Assyrians/Chaldeans/Syriacs | 0.2 /100 | #272 | Tragic 49.1% |
| Immigrants | Iraq | 0.1 /100 | #273 | Tragic 49.1% |
| Immigrants | Guatemala | 0.1 /100 | #274 | Tragic 49.1% |
| Immigrants | Dominica | 0.1 /100 | #275 | Tragic 49.1% |
| Immigrants | Uzbekistan | 0.1 /100 | #276 | Tragic 49.2% |
| Hawaiians | 0.1 /100 | #277 | Tragic 49.2% |
| Immigrants | Laos | 0.1 /100 | #278 | Tragic 49.2% |
| Guamanians/Chamorros | 0.0 /100 | #279 | Tragic 49.4% |
| Bangladeshis | 0.0 /100 | #280 | Tragic 49.4% |
| Belizeans | 0.0 /100 | #281 | Tragic 49.4% |
| Blacks/African Americans | 0.0 /100 | #282 | Tragic 49.5% |
| Samoans | 0.0 /100 | #283 | Tragic 49.5% |