Yuman vs West Indian Ambulatory Disability
COMPARE
Yuman
West Indian
Ambulatory Disability
Ambulatory Disability Comparison
Yuman
West Indians
7.9%
AMBULATORY DISABILITY
0.0/ 100
METRIC RATING
334th/ 347
METRIC RANK
6.9%
AMBULATORY DISABILITY
0.0/ 100
METRIC RATING
291st/ 347
METRIC RANK
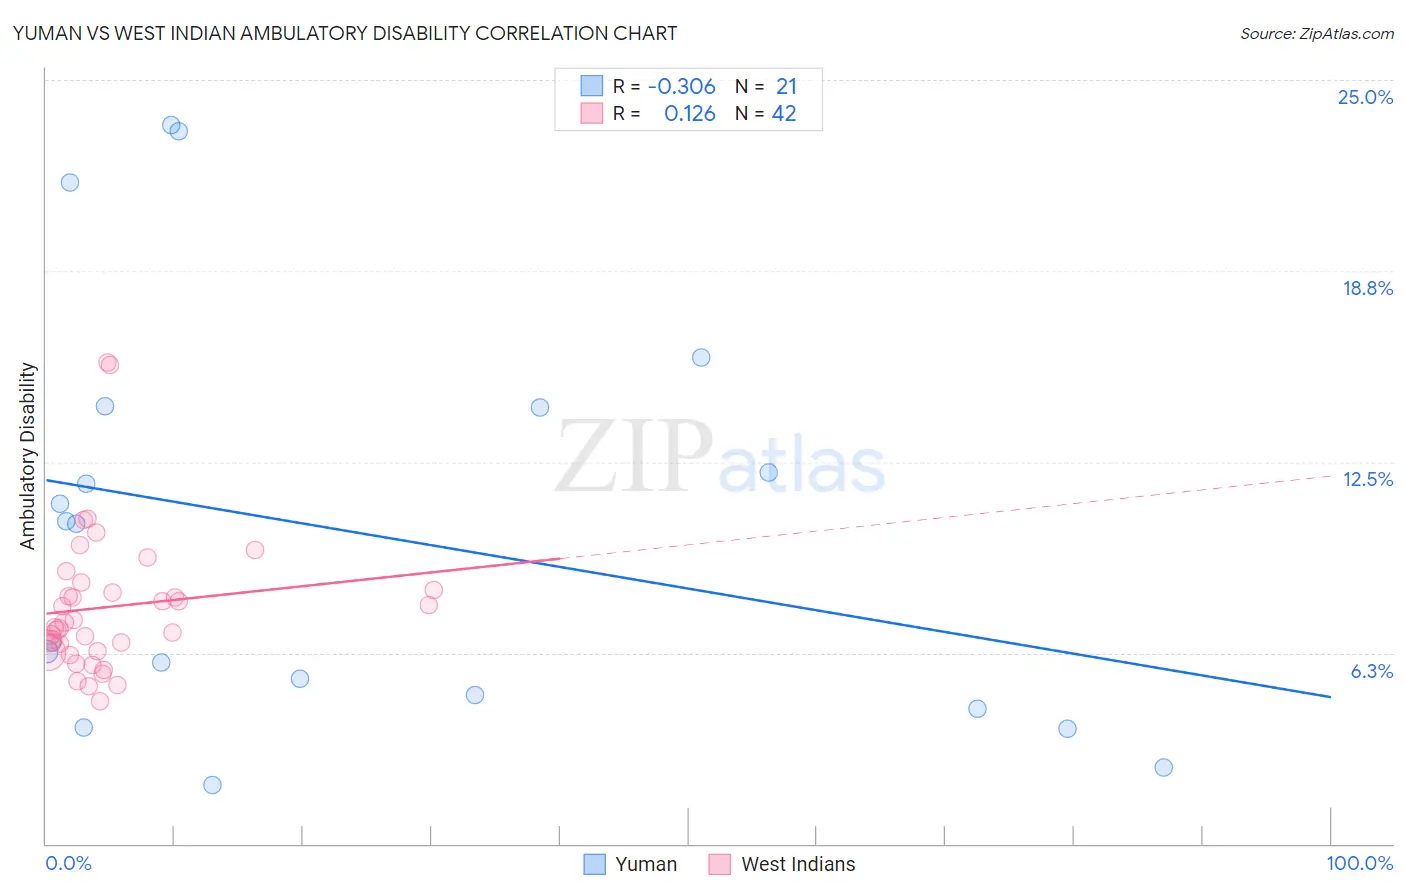
Yuman vs West Indian Ambulatory Disability Correlation Chart
The statistical analysis conducted on geographies consisting of 40,645,433 people shows a mild negative correlation between the proportion of Yuman and percentage of population with ambulatory disability in the United States with a correlation coefficient (R) of -0.306 and weighted average of 7.9%. Similarly, the statistical analysis conducted on geographies consisting of 253,984,061 people shows a poor positive correlation between the proportion of West Indians and percentage of population with ambulatory disability in the United States with a correlation coefficient (R) of 0.126 and weighted average of 6.9%, a difference of 15.7%.
Ambulatory Disability Correlation Summary
| Measurement | Yuman | West Indian |
| Minimum | 1.9% | 4.7% |
| Maximum | 23.5% | 15.7% |
| Range | 21.6% | 11.1% |
| Mean | 10.2% | 7.8% |
| Median | 10.5% | 7.2% |
| Interquartile 25% (IQ1) | 4.6% | 6.3% |
| Interquartile 75% (IQ3) | 14.3% | 8.3% |
| Interquartile Range (IQR) | 9.7% | 2.0% |
| Standard Deviation (Sample) | 6.7% | 2.3% |
| Standard Deviation (Population) | 6.5% | 2.3% |
Similar Demographics by Ambulatory Disability
Demographics Similar to Yuman by Ambulatory Disability
In terms of ambulatory disability, the demographic groups most similar to Yuman are Cherokee (7.9%, a difference of 0.94%), Chickasaw (8.0%, a difference of 1.1%), Seminole (8.0%, a difference of 1.2%), Menominee (7.8%, a difference of 1.8%), and Cajun (7.8%, a difference of 2.1%).
| Demographics | Rating | Rank | Ambulatory Disability |
| Natives/Alaskans | 0.0 /100 | #327 | Tragic 7.5% |
| Hopi | 0.0 /100 | #328 | Tragic 7.6% |
| Pueblo | 0.0 /100 | #329 | Tragic 7.6% |
| Paiute | 0.0 /100 | #330 | Tragic 7.7% |
| Cajuns | 0.0 /100 | #331 | Tragic 7.8% |
| Menominee | 0.0 /100 | #332 | Tragic 7.8% |
| Cherokee | 0.0 /100 | #333 | Tragic 7.9% |
| Yuman | 0.0 /100 | #334 | Tragic 7.9% |
| Chickasaw | 0.0 /100 | #335 | Tragic 8.0% |
| Seminole | 0.0 /100 | #336 | Tragic 8.0% |
| Dutch West Indians | 0.0 /100 | #337 | Tragic 8.2% |
| Colville | 0.0 /100 | #338 | Tragic 8.2% |
| Pima | 0.0 /100 | #339 | Tragic 8.2% |
| Choctaw | 0.0 /100 | #340 | Tragic 8.3% |
| Creek | 0.0 /100 | #341 | Tragic 8.5% |
Demographics Similar to West Indians by Ambulatory Disability
In terms of ambulatory disability, the demographic groups most similar to West Indians are Cheyenne (6.9%, a difference of 0.060%), Scotch-Irish (6.9%, a difference of 0.10%), Immigrants from Dominica (6.9%, a difference of 0.12%), Nonimmigrants (6.9%, a difference of 0.27%), and Immigrants from St. Vincent and the Grenadines (6.9%, a difference of 0.30%).
| Demographics | Rating | Rank | Ambulatory Disability |
| Immigrants | Jamaica | 0.0 /100 | #284 | Tragic 6.8% |
| Fijians | 0.0 /100 | #285 | Tragic 6.8% |
| Yakama | 0.0 /100 | #286 | Tragic 6.8% |
| U.S. Virgin Islanders | 0.0 /100 | #287 | Tragic 6.8% |
| Immigrants | Nonimmigrants | 0.0 /100 | #288 | Tragic 6.9% |
| Immigrants | Dominica | 0.0 /100 | #289 | Tragic 6.9% |
| Scotch-Irish | 0.0 /100 | #290 | Tragic 6.9% |
| West Indians | 0.0 /100 | #291 | Tragic 6.9% |
| Cheyenne | 0.0 /100 | #292 | Tragic 6.9% |
| Immigrants | St. Vincent and the Grenadines | 0.0 /100 | #293 | Tragic 6.9% |
| Cape Verdeans | 0.0 /100 | #294 | Tragic 6.9% |
| Crow | 0.0 /100 | #295 | Tragic 6.9% |
| Alaskan Athabascans | 0.0 /100 | #296 | Tragic 6.9% |
| French American Indians | 0.0 /100 | #297 | Tragic 6.9% |
| Immigrants | Grenada | 0.0 /100 | #298 | Tragic 6.9% |