Yuman vs Immigrants from Yemen Ambulatory Disability
COMPARE
Yuman
Immigrants from Yemen
Ambulatory Disability
Ambulatory Disability Comparison
Yuman
Immigrants from Yemen
7.9%
AMBULATORY DISABILITY
0.0/ 100
METRIC RATING
334th/ 347
METRIC RANK
7.1%
AMBULATORY DISABILITY
0.0/ 100
METRIC RATING
313th/ 347
METRIC RANK
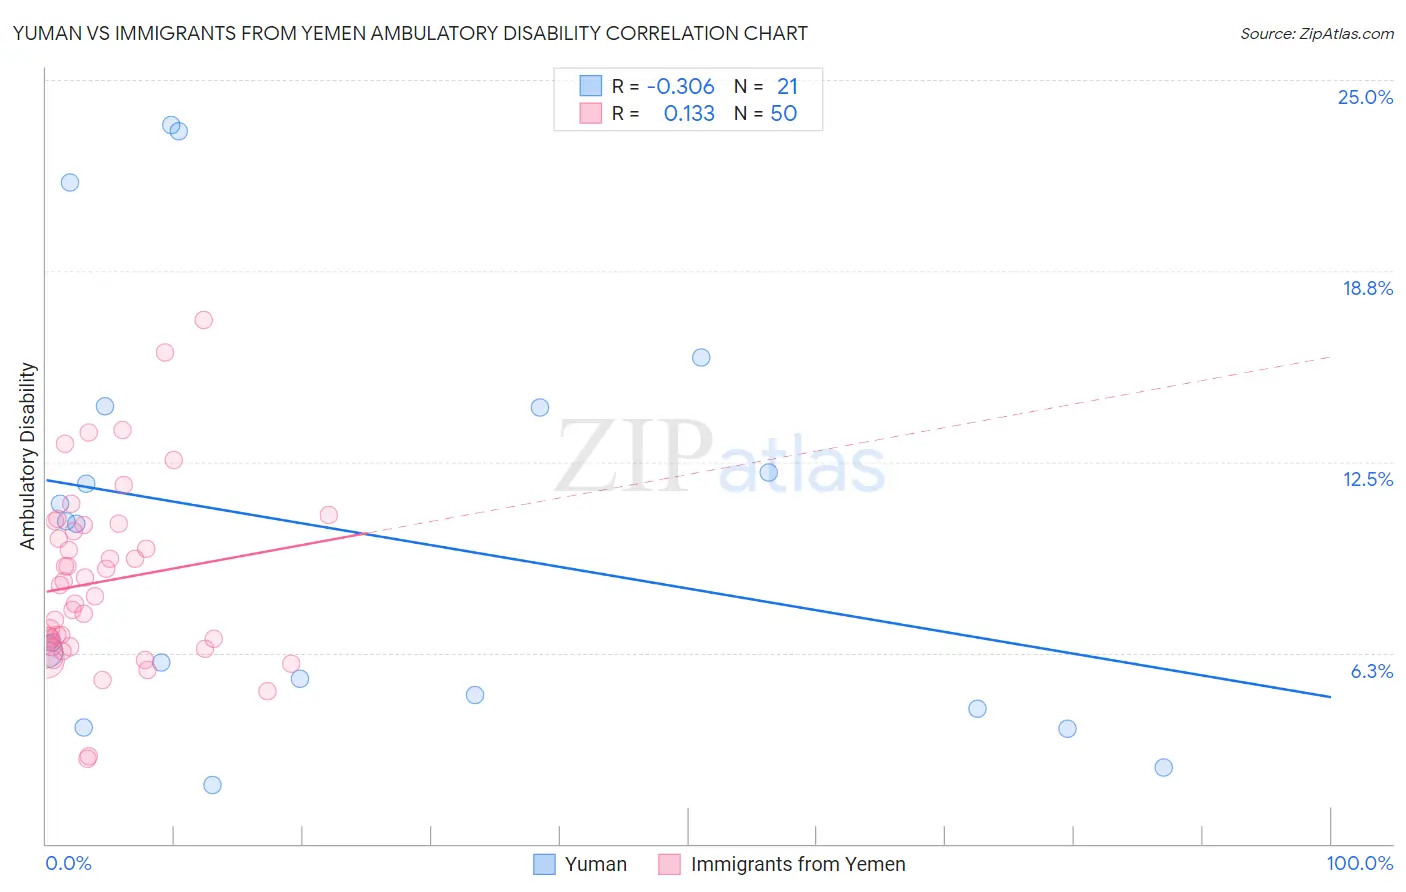
Yuman vs Immigrants from Yemen Ambulatory Disability Correlation Chart
The statistical analysis conducted on geographies consisting of 40,645,433 people shows a mild negative correlation between the proportion of Yuman and percentage of population with ambulatory disability in the United States with a correlation coefficient (R) of -0.306 and weighted average of 7.9%. Similarly, the statistical analysis conducted on geographies consisting of 82,432,015 people shows a poor positive correlation between the proportion of Immigrants from Yemen and percentage of population with ambulatory disability in the United States with a correlation coefficient (R) of 0.133 and weighted average of 7.1%, a difference of 11.5%.
Ambulatory Disability Correlation Summary
| Measurement | Yuman | Immigrants from Yemen |
| Minimum | 1.9% | 2.8% |
| Maximum | 23.5% | 17.1% |
| Range | 21.6% | 14.4% |
| Mean | 10.2% | 8.6% |
| Median | 10.5% | 8.3% |
| Interquartile 25% (IQ1) | 4.6% | 6.4% |
| Interquartile 75% (IQ3) | 14.3% | 10.4% |
| Interquartile Range (IQR) | 9.7% | 4.0% |
| Standard Deviation (Sample) | 6.7% | 3.0% |
| Standard Deviation (Population) | 6.5% | 2.9% |
Similar Demographics by Ambulatory Disability
Demographics Similar to Yuman by Ambulatory Disability
In terms of ambulatory disability, the demographic groups most similar to Yuman are Cherokee (7.9%, a difference of 0.94%), Chickasaw (8.0%, a difference of 1.1%), Seminole (8.0%, a difference of 1.2%), Menominee (7.8%, a difference of 1.8%), and Cajun (7.8%, a difference of 2.1%).
| Demographics | Rating | Rank | Ambulatory Disability |
| Natives/Alaskans | 0.0 /100 | #327 | Tragic 7.5% |
| Hopi | 0.0 /100 | #328 | Tragic 7.6% |
| Pueblo | 0.0 /100 | #329 | Tragic 7.6% |
| Paiute | 0.0 /100 | #330 | Tragic 7.7% |
| Cajuns | 0.0 /100 | #331 | Tragic 7.8% |
| Menominee | 0.0 /100 | #332 | Tragic 7.8% |
| Cherokee | 0.0 /100 | #333 | Tragic 7.9% |
| Yuman | 0.0 /100 | #334 | Tragic 7.9% |
| Chickasaw | 0.0 /100 | #335 | Tragic 8.0% |
| Seminole | 0.0 /100 | #336 | Tragic 8.0% |
| Dutch West Indians | 0.0 /100 | #337 | Tragic 8.2% |
| Colville | 0.0 /100 | #338 | Tragic 8.2% |
| Pima | 0.0 /100 | #339 | Tragic 8.2% |
| Choctaw | 0.0 /100 | #340 | Tragic 8.3% |
| Creek | 0.0 /100 | #341 | Tragic 8.5% |
Demographics Similar to Immigrants from Yemen by Ambulatory Disability
In terms of ambulatory disability, the demographic groups most similar to Immigrants from Yemen are Blackfeet (7.1%, a difference of 0.020%), Shoshone (7.1%, a difference of 0.040%), Delaware (7.1%, a difference of 0.13%), Immigrants from Dominican Republic (7.1%, a difference of 0.28%), and Cree (7.1%, a difference of 0.35%).
| Demographics | Rating | Rank | Ambulatory Disability |
| Iroquois | 0.0 /100 | #306 | Tragic 7.1% |
| Spanish Americans | 0.0 /100 | #307 | Tragic 7.1% |
| Chippewa | 0.0 /100 | #308 | Tragic 7.1% |
| Immigrants | Azores | 0.0 /100 | #309 | Tragic 7.1% |
| Arapaho | 0.0 /100 | #310 | Tragic 7.1% |
| Cree | 0.0 /100 | #311 | Tragic 7.1% |
| Delaware | 0.0 /100 | #312 | Tragic 7.1% |
| Immigrants | Yemen | 0.0 /100 | #313 | Tragic 7.1% |
| Blackfeet | 0.0 /100 | #314 | Tragic 7.1% |
| Shoshone | 0.0 /100 | #315 | Tragic 7.1% |
| Immigrants | Dominican Republic | 0.0 /100 | #316 | Tragic 7.1% |
| Central American Indians | 0.0 /100 | #317 | Tragic 7.2% |
| Ottawa | 0.0 /100 | #318 | Tragic 7.2% |
| Dominicans | 0.0 /100 | #319 | Tragic 7.2% |
| Potawatomi | 0.0 /100 | #320 | Tragic 7.3% |