Yugoslavian vs Lebanese Ambulatory Disability
COMPARE
Yugoslavian
Lebanese
Ambulatory Disability
Ambulatory Disability Comparison
Yugoslavians
Lebanese
6.3%
AMBULATORY DISABILITY
10.9/ 100
METRIC RATING
217th/ 347
METRIC RANK
6.1%
AMBULATORY DISABILITY
66.2/ 100
METRIC RATING
163rd/ 347
METRIC RANK
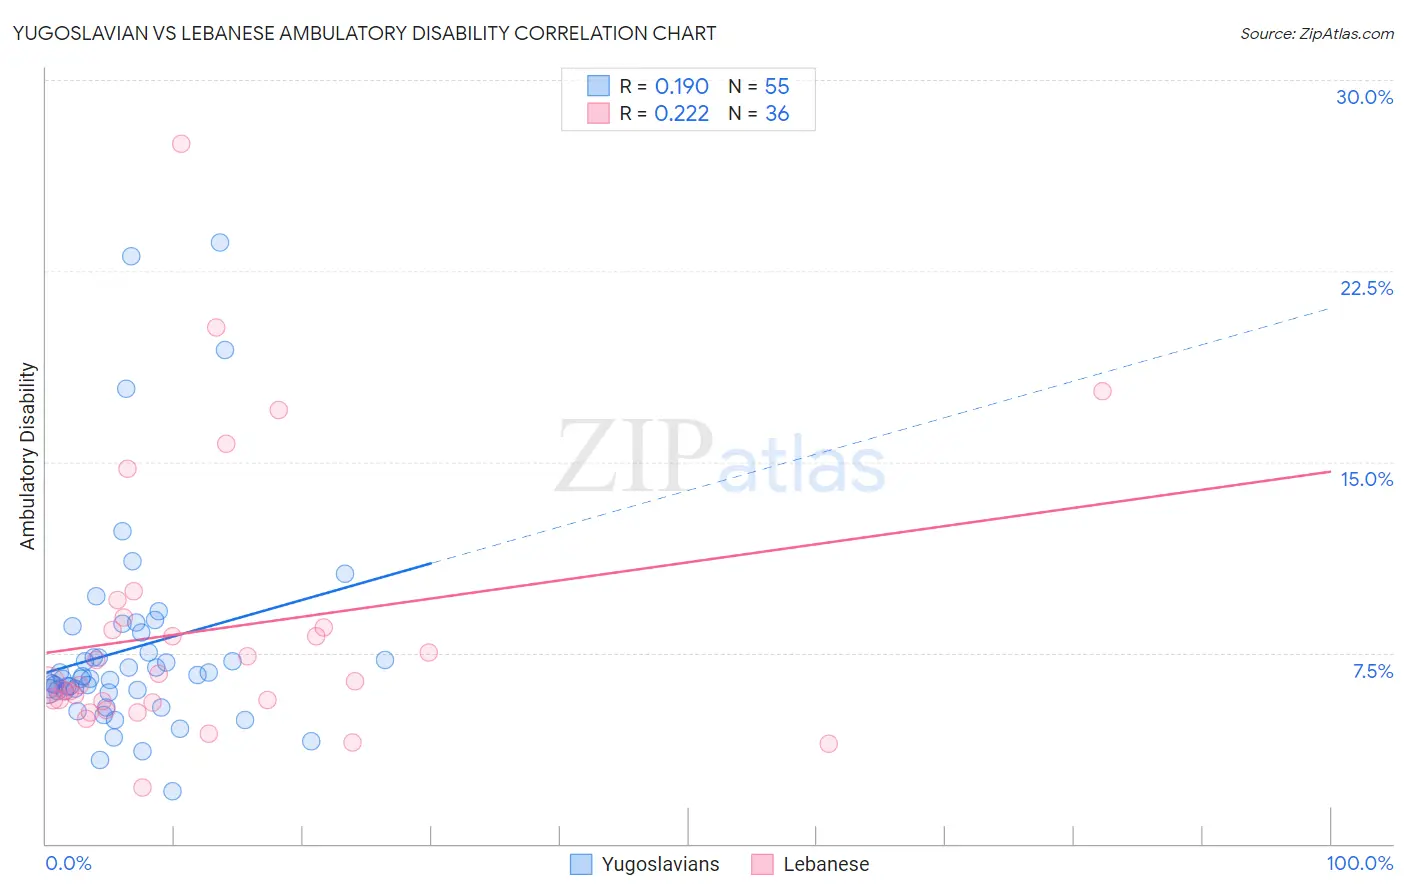
Yugoslavian vs Lebanese Ambulatory Disability Correlation Chart
The statistical analysis conducted on geographies consisting of 285,658,107 people shows a poor positive correlation between the proportion of Yugoslavians and percentage of population with ambulatory disability in the United States with a correlation coefficient (R) of 0.190 and weighted average of 6.3%. Similarly, the statistical analysis conducted on geographies consisting of 401,495,735 people shows a weak positive correlation between the proportion of Lebanese and percentage of population with ambulatory disability in the United States with a correlation coefficient (R) of 0.222 and weighted average of 6.1%, a difference of 3.7%.
Ambulatory Disability Correlation Summary
| Measurement | Yugoslavian | Lebanese |
| Minimum | 2.0% | 2.2% |
| Maximum | 23.6% | 27.5% |
| Range | 21.6% | 25.3% |
| Mean | 7.7% | 8.4% |
| Median | 6.5% | 6.3% |
| Interquartile 25% (IQ1) | 6.0% | 5.6% |
| Interquartile 75% (IQ3) | 8.3% | 8.7% |
| Interquartile Range (IQR) | 2.3% | 3.1% |
| Standard Deviation (Sample) | 4.2% | 5.3% |
| Standard Deviation (Population) | 4.2% | 5.2% |
Similar Demographics by Ambulatory Disability
Demographics Similar to Yugoslavians by Ambulatory Disability
In terms of ambulatory disability, the demographic groups most similar to Yugoslavians are Canadian (6.3%, a difference of 0.0%), Immigrants from Latin America (6.3%, a difference of 0.010%), Immigrants from Mexico (6.3%, a difference of 0.020%), Guamanian/Chamorro (6.3%, a difference of 0.040%), and Mexican American Indian (6.3%, a difference of 0.14%).
| Demographics | Rating | Rank | Ambulatory Disability |
| Immigrants | Laos | 13.2 /100 | #210 | Poor 6.3% |
| Samoans | 12.1 /100 | #211 | Poor 6.3% |
| Mexican American Indians | 12.0 /100 | #212 | Poor 6.3% |
| Japanese | 12.0 /100 | #213 | Poor 6.3% |
| Immigrants | Mexico | 11.0 /100 | #214 | Poor 6.3% |
| Immigrants | Latin America | 11.0 /100 | #215 | Poor 6.3% |
| Canadians | 10.9 /100 | #216 | Poor 6.3% |
| Yugoslavians | 10.9 /100 | #217 | Poor 6.3% |
| Guamanians/Chamorros | 10.6 /100 | #218 | Poor 6.3% |
| Indonesians | 9.9 /100 | #219 | Tragic 6.3% |
| Immigrants | Albania | 9.6 /100 | #220 | Tragic 6.3% |
| Hungarians | 9.6 /100 | #221 | Tragic 6.3% |
| German Russians | 9.4 /100 | #222 | Tragic 6.3% |
| Immigrants | Honduras | 7.6 /100 | #223 | Tragic 6.3% |
| Liberians | 7.1 /100 | #224 | Tragic 6.3% |
Demographics Similar to Lebanese by Ambulatory Disability
In terms of ambulatory disability, the demographic groups most similar to Lebanese are Nigerian (6.1%, a difference of 0.050%), Basque (6.1%, a difference of 0.15%), Immigrants from Belarus (6.1%, a difference of 0.18%), Nicaraguan (6.1%, a difference of 0.18%), and Iraqi (6.1%, a difference of 0.20%).
| Demographics | Rating | Rank | Ambulatory Disability |
| Northern Europeans | 71.8 /100 | #156 | Good 6.0% |
| Ghanaians | 71.3 /100 | #157 | Good 6.0% |
| Immigrants | Fiji | 71.2 /100 | #158 | Good 6.0% |
| Immigrants | Latvia | 71.1 /100 | #159 | Good 6.0% |
| Central Americans | 69.8 /100 | #160 | Good 6.0% |
| Immigrants | Belarus | 69.2 /100 | #161 | Good 6.1% |
| Nigerians | 67.1 /100 | #162 | Good 6.1% |
| Lebanese | 66.2 /100 | #163 | Good 6.1% |
| Basques | 63.7 /100 | #164 | Good 6.1% |
| Nicaraguans | 63.2 /100 | #165 | Good 6.1% |
| Iraqis | 62.8 /100 | #166 | Good 6.1% |
| Immigrants | Oceania | 60.7 /100 | #167 | Good 6.1% |
| Ecuadorians | 60.5 /100 | #168 | Good 6.1% |
| Immigrants | Southern Europe | 58.1 /100 | #169 | Average 6.1% |
| Immigrants | Ecuador | 53.8 /100 | #170 | Average 6.1% |