Immigrants from Latin America vs Lebanese Ambulatory Disability
COMPARE
Immigrants from Latin America
Lebanese
Ambulatory Disability
Ambulatory Disability Comparison
Immigrants from Latin America
Lebanese
6.3%
AMBULATORY DISABILITY
11.0/ 100
METRIC RATING
215th/ 347
METRIC RANK
6.1%
AMBULATORY DISABILITY
66.2/ 100
METRIC RATING
163rd/ 347
METRIC RANK
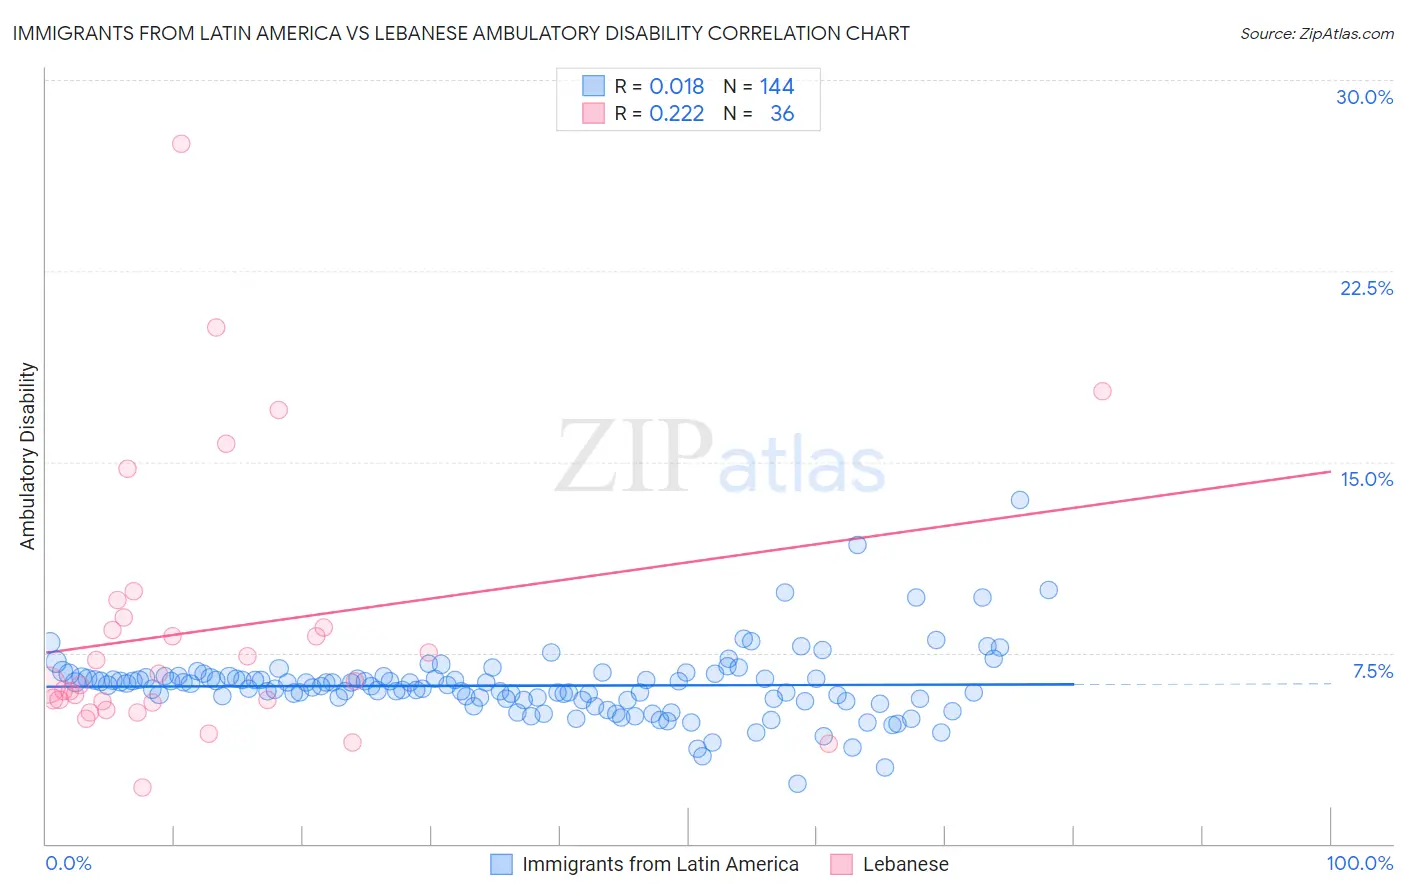
Immigrants from Latin America vs Lebanese Ambulatory Disability Correlation Chart
The statistical analysis conducted on geographies consisting of 558,117,601 people shows no correlation between the proportion of Immigrants from Latin America and percentage of population with ambulatory disability in the United States with a correlation coefficient (R) of 0.018 and weighted average of 6.3%. Similarly, the statistical analysis conducted on geographies consisting of 401,495,735 people shows a weak positive correlation between the proportion of Lebanese and percentage of population with ambulatory disability in the United States with a correlation coefficient (R) of 0.222 and weighted average of 6.1%, a difference of 3.7%.
Ambulatory Disability Correlation Summary
| Measurement | Immigrants from Latin America | Lebanese |
| Minimum | 2.4% | 2.2% |
| Maximum | 13.5% | 27.5% |
| Range | 11.1% | 25.3% |
| Mean | 6.2% | 8.4% |
| Median | 6.2% | 6.3% |
| Interquartile 25% (IQ1) | 5.7% | 5.6% |
| Interquartile 75% (IQ3) | 6.5% | 8.7% |
| Interquartile Range (IQR) | 0.86% | 3.1% |
| Standard Deviation (Sample) | 1.4% | 5.3% |
| Standard Deviation (Population) | 1.4% | 5.2% |
Similar Demographics by Ambulatory Disability
Demographics Similar to Immigrants from Latin America by Ambulatory Disability
In terms of ambulatory disability, the demographic groups most similar to Immigrants from Latin America are Immigrants from Mexico (6.3%, a difference of 0.010%), Canadian (6.3%, a difference of 0.010%), Yugoslavian (6.3%, a difference of 0.010%), Guamanian/Chamorro (6.3%, a difference of 0.050%), and Mexican American Indian (6.3%, a difference of 0.13%).
| Demographics | Rating | Rank | Ambulatory Disability |
| Bangladeshis | 14.2 /100 | #208 | Poor 6.3% |
| Immigrants | Iraq | 14.0 /100 | #209 | Poor 6.3% |
| Immigrants | Laos | 13.2 /100 | #210 | Poor 6.3% |
| Samoans | 12.1 /100 | #211 | Poor 6.3% |
| Mexican American Indians | 12.0 /100 | #212 | Poor 6.3% |
| Japanese | 12.0 /100 | #213 | Poor 6.3% |
| Immigrants | Mexico | 11.0 /100 | #214 | Poor 6.3% |
| Immigrants | Latin America | 11.0 /100 | #215 | Poor 6.3% |
| Canadians | 10.9 /100 | #216 | Poor 6.3% |
| Yugoslavians | 10.9 /100 | #217 | Poor 6.3% |
| Guamanians/Chamorros | 10.6 /100 | #218 | Poor 6.3% |
| Indonesians | 9.9 /100 | #219 | Tragic 6.3% |
| Immigrants | Albania | 9.6 /100 | #220 | Tragic 6.3% |
| Hungarians | 9.6 /100 | #221 | Tragic 6.3% |
| German Russians | 9.4 /100 | #222 | Tragic 6.3% |
Demographics Similar to Lebanese by Ambulatory Disability
In terms of ambulatory disability, the demographic groups most similar to Lebanese are Nigerian (6.1%, a difference of 0.050%), Basque (6.1%, a difference of 0.15%), Immigrants from Belarus (6.1%, a difference of 0.18%), Nicaraguan (6.1%, a difference of 0.18%), and Iraqi (6.1%, a difference of 0.20%).
| Demographics | Rating | Rank | Ambulatory Disability |
| Northern Europeans | 71.8 /100 | #156 | Good 6.0% |
| Ghanaians | 71.3 /100 | #157 | Good 6.0% |
| Immigrants | Fiji | 71.2 /100 | #158 | Good 6.0% |
| Immigrants | Latvia | 71.1 /100 | #159 | Good 6.0% |
| Central Americans | 69.8 /100 | #160 | Good 6.0% |
| Immigrants | Belarus | 69.2 /100 | #161 | Good 6.1% |
| Nigerians | 67.1 /100 | #162 | Good 6.1% |
| Lebanese | 66.2 /100 | #163 | Good 6.1% |
| Basques | 63.7 /100 | #164 | Good 6.1% |
| Nicaraguans | 63.2 /100 | #165 | Good 6.1% |
| Iraqis | 62.8 /100 | #166 | Good 6.1% |
| Immigrants | Oceania | 60.7 /100 | #167 | Good 6.1% |
| Ecuadorians | 60.5 /100 | #168 | Good 6.1% |
| Immigrants | Southern Europe | 58.1 /100 | #169 | Average 6.1% |
| Immigrants | Ecuador | 53.8 /100 | #170 | Average 6.1% |