Yugoslavian vs Lebanese Householder Income Ages 45 - 64 years
COMPARE
Yugoslavian
Lebanese
Householder Income Ages 45 - 64 years
Householder Income Ages 45 - 64 years Comparison
Yugoslavians
Lebanese
$97,558
HOUSEHOLDER INCOME AGES 45 - 64 YEARS
20.0/ 100
METRIC RATING
201st/ 347
METRIC RANK
$104,734
HOUSEHOLDER INCOME AGES 45 - 64 YEARS
90.1/ 100
METRIC RATING
132nd/ 347
METRIC RANK
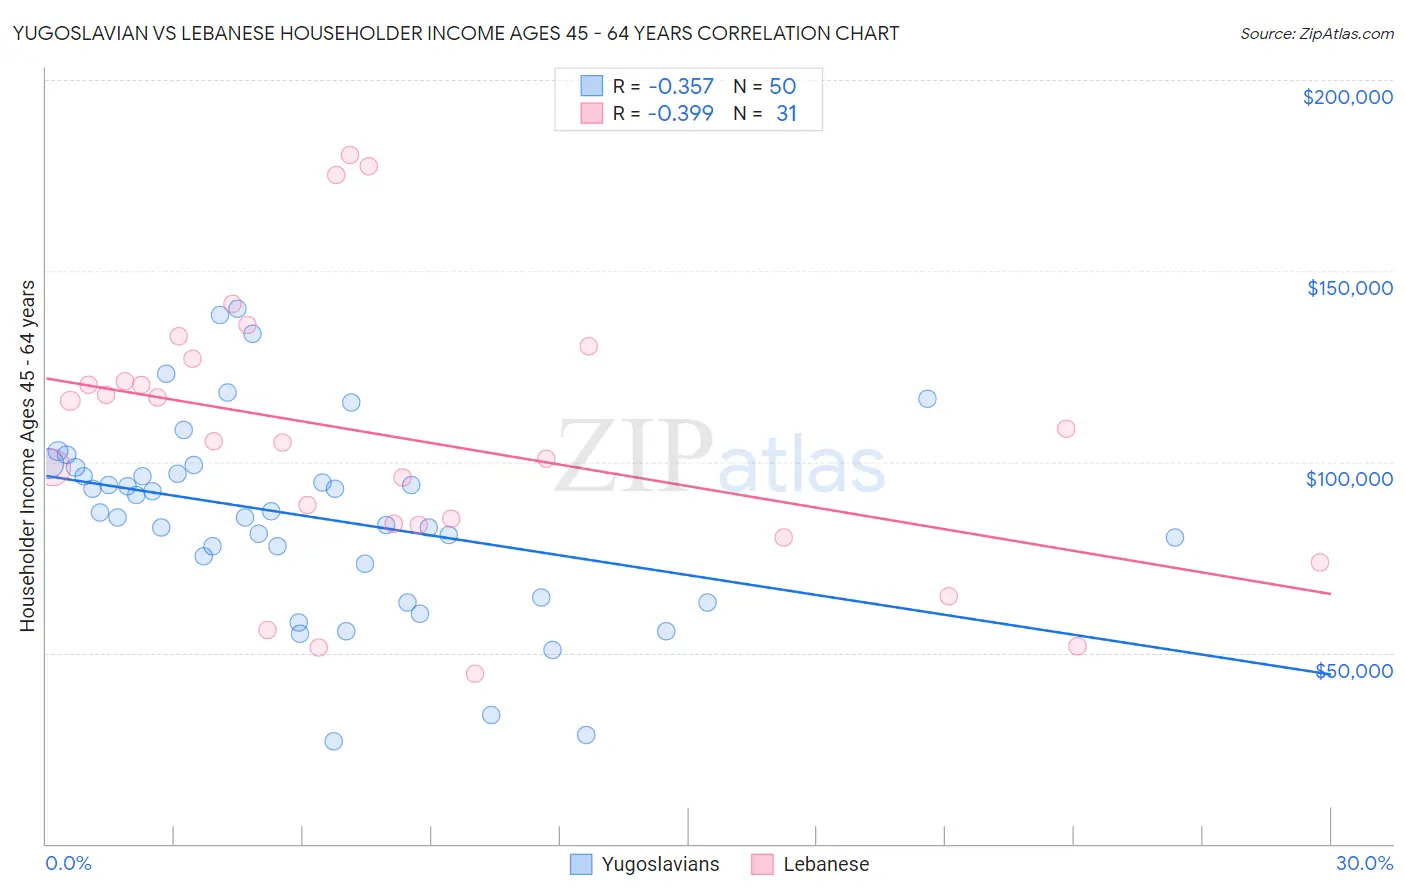
Yugoslavian vs Lebanese Householder Income Ages 45 - 64 years Correlation Chart
The statistical analysis conducted on geographies consisting of 285,465,008 people shows a mild negative correlation between the proportion of Yugoslavians and household income with householder between the ages 45 and 64 in the United States with a correlation coefficient (R) of -0.357 and weighted average of $97,558. Similarly, the statistical analysis conducted on geographies consisting of 400,891,576 people shows a mild negative correlation between the proportion of Lebanese and household income with householder between the ages 45 and 64 in the United States with a correlation coefficient (R) of -0.399 and weighted average of $104,734, a difference of 7.3%.
Householder Income Ages 45 - 64 years Correlation Summary
| Measurement | Yugoslavian | Lebanese |
| Minimum | $26,989 | $44,583 |
| Maximum | $140,097 | $180,429 |
| Range | $113,108 | $135,846 |
| Mean | $85,735 | $106,151 |
| Median | $86,945 | $105,539 |
| Interquartile 25% (IQ1) | $73,466 | $83,438 |
| Interquartile 75% (IQ3) | $98,460 | $126,958 |
| Interquartile Range (IQR) | $24,994 | $43,520 |
| Standard Deviation (Sample) | $25,335 | $35,508 |
| Standard Deviation (Population) | $25,080 | $34,931 |
Similar Demographics by Householder Income Ages 45 - 64 years
Demographics Similar to Yugoslavians by Householder Income Ages 45 - 64 years
In terms of householder income ages 45 - 64 years, the demographic groups most similar to Yugoslavians are Tlingit-Haida ($97,417, a difference of 0.15%), Immigrants from Thailand ($97,400, a difference of 0.16%), Immigrants from Eritrea ($97,373, a difference of 0.19%), Immigrants from Colombia ($97,290, a difference of 0.28%), and Immigrants from Africa ($97,284, a difference of 0.28%).
| Demographics | Rating | Rank | Householder Income Ages 45 - 64 years |
| Uruguayans | 30.3 /100 | #194 | Fair $98,660 |
| Spanish | 29.2 /100 | #195 | Fair $98,554 |
| Immigrants | Eastern Africa | 28.3 /100 | #196 | Fair $98,467 |
| Puget Sound Salish | 27.0 /100 | #197 | Fair $98,340 |
| Immigrants | Iraq | 25.7 /100 | #198 | Fair $98,201 |
| Whites/Caucasians | 24.6 /100 | #199 | Fair $98,091 |
| Immigrants | Kenya | 23.5 /100 | #200 | Fair $97,964 |
| Yugoslavians | 20.0 /100 | #201 | Fair $97,558 |
| Tlingit-Haida | 18.9 /100 | #202 | Poor $97,417 |
| Immigrants | Thailand | 18.8 /100 | #203 | Poor $97,400 |
| Immigrants | Eritrea | 18.6 /100 | #204 | Poor $97,373 |
| Immigrants | Colombia | 18.0 /100 | #205 | Poor $97,290 |
| Immigrants | Africa | 17.9 /100 | #206 | Poor $97,284 |
| Ghanaians | 17.9 /100 | #207 | Poor $97,277 |
| Scotch-Irish | 16.4 /100 | #208 | Poor $97,073 |
Demographics Similar to Lebanese by Householder Income Ages 45 - 64 years
In terms of householder income ages 45 - 64 years, the demographic groups most similar to Lebanese are Immigrants from Syria ($104,858, a difference of 0.12%), Arab ($104,566, a difference of 0.16%), Canadian ($104,560, a difference of 0.17%), Immigrants from Zimbabwe ($104,992, a difference of 0.25%), and Brazilian ($104,408, a difference of 0.31%).
| Demographics | Rating | Rank | Householder Income Ages 45 - 64 years |
| Pakistanis | 92.4 /100 | #125 | Exceptional $105,317 |
| Portuguese | 92.4 /100 | #126 | Exceptional $105,309 |
| Immigrants | Saudi Arabia | 92.2 /100 | #127 | Exceptional $105,249 |
| Native Hawaiians | 91.8 /100 | #128 | Exceptional $105,149 |
| Peruvians | 91.5 /100 | #129 | Exceptional $105,070 |
| Immigrants | Zimbabwe | 91.2 /100 | #130 | Exceptional $104,992 |
| Immigrants | Syria | 90.7 /100 | #131 | Exceptional $104,858 |
| Lebanese | 90.1 /100 | #132 | Exceptional $104,734 |
| Arabs | 89.3 /100 | #133 | Excellent $104,566 |
| Canadians | 89.3 /100 | #134 | Excellent $104,560 |
| Brazilians | 88.6 /100 | #135 | Excellent $104,408 |
| Taiwanese | 87.4 /100 | #136 | Excellent $104,180 |
| Hungarians | 85.8 /100 | #137 | Excellent $103,913 |
| Ethiopians | 84.7 /100 | #138 | Excellent $103,736 |
| Immigrants | Oceania | 84.5 /100 | #139 | Excellent $103,705 |