Nonimmigrants vs Lebanese Ambulatory Disability
COMPARE
Nonimmigrants
Lebanese
Ambulatory Disability
Ambulatory Disability Comparison
Nonimmigrants
Lebanese
6.9%
AMBULATORY DISABILITY
0.0/ 100
METRIC RATING
288th/ 347
METRIC RANK
6.1%
AMBULATORY DISABILITY
66.2/ 100
METRIC RATING
163rd/ 347
METRIC RANK
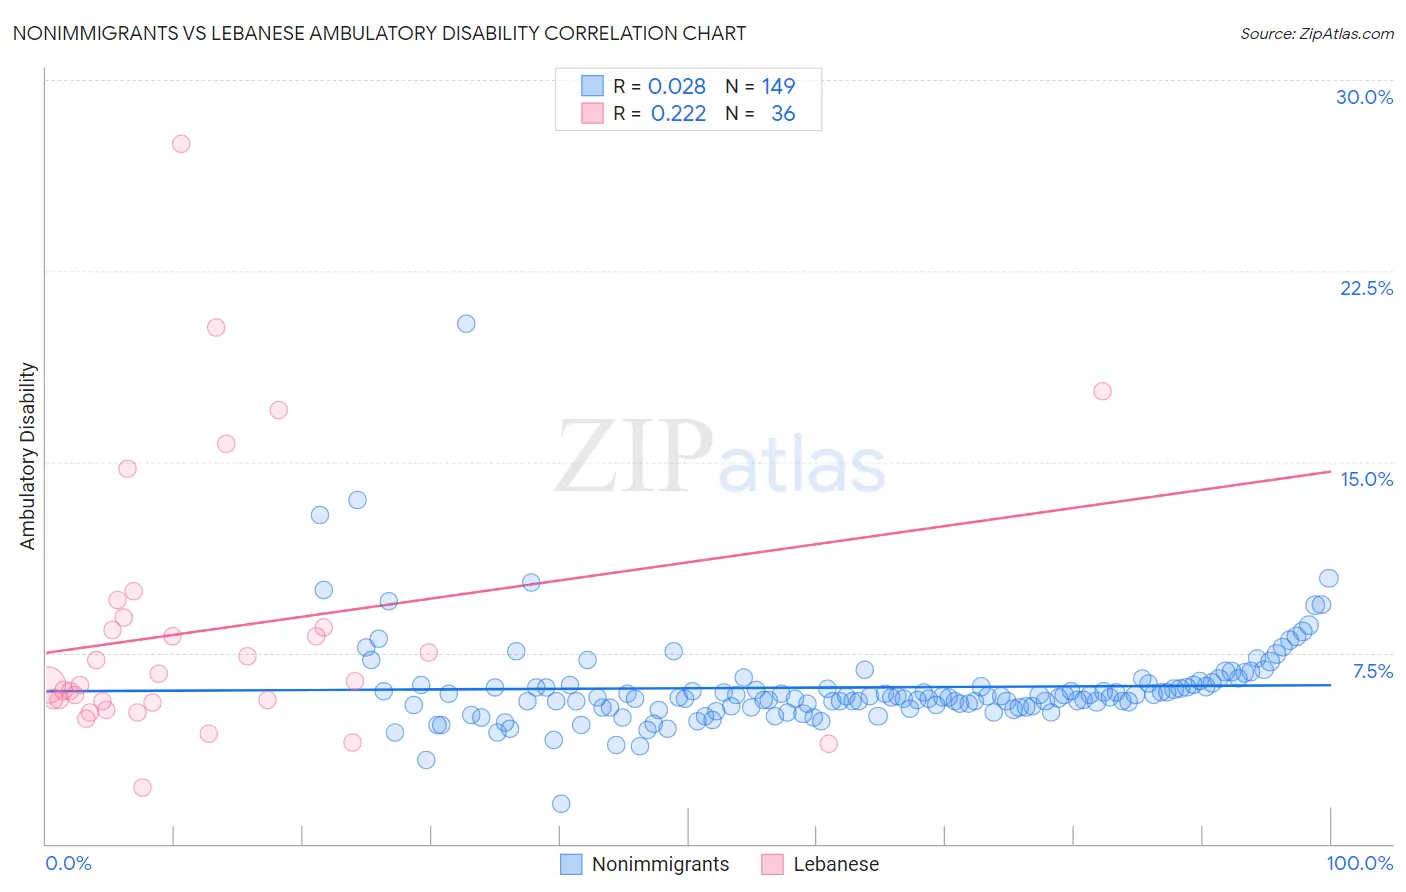
Nonimmigrants vs Lebanese Ambulatory Disability Correlation Chart
The statistical analysis conducted on geographies consisting of 584,325,810 people shows no correlation between the proportion of Nonimmigrants and percentage of population with ambulatory disability in the United States with a correlation coefficient (R) of 0.028 and weighted average of 6.9%. Similarly, the statistical analysis conducted on geographies consisting of 401,495,735 people shows a weak positive correlation between the proportion of Lebanese and percentage of population with ambulatory disability in the United States with a correlation coefficient (R) of 0.222 and weighted average of 6.1%, a difference of 13.0%.
Ambulatory Disability Correlation Summary
| Measurement | Nonimmigrants | Lebanese |
| Minimum | 1.6% | 2.2% |
| Maximum | 20.4% | 27.5% |
| Range | 18.8% | 25.3% |
| Mean | 6.1% | 8.4% |
| Median | 5.8% | 6.3% |
| Interquartile 25% (IQ1) | 5.4% | 5.6% |
| Interquartile 75% (IQ3) | 6.2% | 8.7% |
| Interquartile Range (IQR) | 0.88% | 3.1% |
| Standard Deviation (Sample) | 1.9% | 5.3% |
| Standard Deviation (Population) | 1.9% | 5.2% |
Similar Demographics by Ambulatory Disability
Demographics Similar to Nonimmigrants by Ambulatory Disability
In terms of ambulatory disability, the demographic groups most similar to Nonimmigrants are Immigrants from Dominica (6.9%, a difference of 0.14%), Scotch-Irish (6.9%, a difference of 0.17%), U.S. Virgin Islander (6.8%, a difference of 0.27%), West Indian (6.9%, a difference of 0.27%), and Cheyenne (6.9%, a difference of 0.33%).
| Demographics | Rating | Rank | Ambulatory Disability |
| Yaqui | 0.0 /100 | #281 | Tragic 6.8% |
| Barbadians | 0.0 /100 | #282 | Tragic 6.8% |
| Immigrants | Barbados | 0.0 /100 | #283 | Tragic 6.8% |
| Immigrants | Jamaica | 0.0 /100 | #284 | Tragic 6.8% |
| Fijians | 0.0 /100 | #285 | Tragic 6.8% |
| Yakama | 0.0 /100 | #286 | Tragic 6.8% |
| U.S. Virgin Islanders | 0.0 /100 | #287 | Tragic 6.8% |
| Immigrants | Nonimmigrants | 0.0 /100 | #288 | Tragic 6.9% |
| Immigrants | Dominica | 0.0 /100 | #289 | Tragic 6.9% |
| Scotch-Irish | 0.0 /100 | #290 | Tragic 6.9% |
| West Indians | 0.0 /100 | #291 | Tragic 6.9% |
| Cheyenne | 0.0 /100 | #292 | Tragic 6.9% |
| Immigrants | St. Vincent and the Grenadines | 0.0 /100 | #293 | Tragic 6.9% |
| Cape Verdeans | 0.0 /100 | #294 | Tragic 6.9% |
| Crow | 0.0 /100 | #295 | Tragic 6.9% |
Demographics Similar to Lebanese by Ambulatory Disability
In terms of ambulatory disability, the demographic groups most similar to Lebanese are Nigerian (6.1%, a difference of 0.050%), Basque (6.1%, a difference of 0.15%), Immigrants from Belarus (6.1%, a difference of 0.18%), Nicaraguan (6.1%, a difference of 0.18%), and Iraqi (6.1%, a difference of 0.20%).
| Demographics | Rating | Rank | Ambulatory Disability |
| Northern Europeans | 71.8 /100 | #156 | Good 6.0% |
| Ghanaians | 71.3 /100 | #157 | Good 6.0% |
| Immigrants | Fiji | 71.2 /100 | #158 | Good 6.0% |
| Immigrants | Latvia | 71.1 /100 | #159 | Good 6.0% |
| Central Americans | 69.8 /100 | #160 | Good 6.0% |
| Immigrants | Belarus | 69.2 /100 | #161 | Good 6.1% |
| Nigerians | 67.1 /100 | #162 | Good 6.1% |
| Lebanese | 66.2 /100 | #163 | Good 6.1% |
| Basques | 63.7 /100 | #164 | Good 6.1% |
| Nicaraguans | 63.2 /100 | #165 | Good 6.1% |
| Iraqis | 62.8 /100 | #166 | Good 6.1% |
| Immigrants | Oceania | 60.7 /100 | #167 | Good 6.1% |
| Ecuadorians | 60.5 /100 | #168 | Good 6.1% |
| Immigrants | Southern Europe | 58.1 /100 | #169 | Average 6.1% |
| Immigrants | Ecuador | 53.8 /100 | #170 | Average 6.1% |