Yugoslavian vs Cherokee Ambulatory Disability
COMPARE
Yugoslavian
Cherokee
Ambulatory Disability
Ambulatory Disability Comparison
Yugoslavians
Cherokee
6.3%
AMBULATORY DISABILITY
10.9/ 100
METRIC RATING
217th/ 347
METRIC RANK
7.9%
AMBULATORY DISABILITY
0.0/ 100
METRIC RATING
333rd/ 347
METRIC RANK
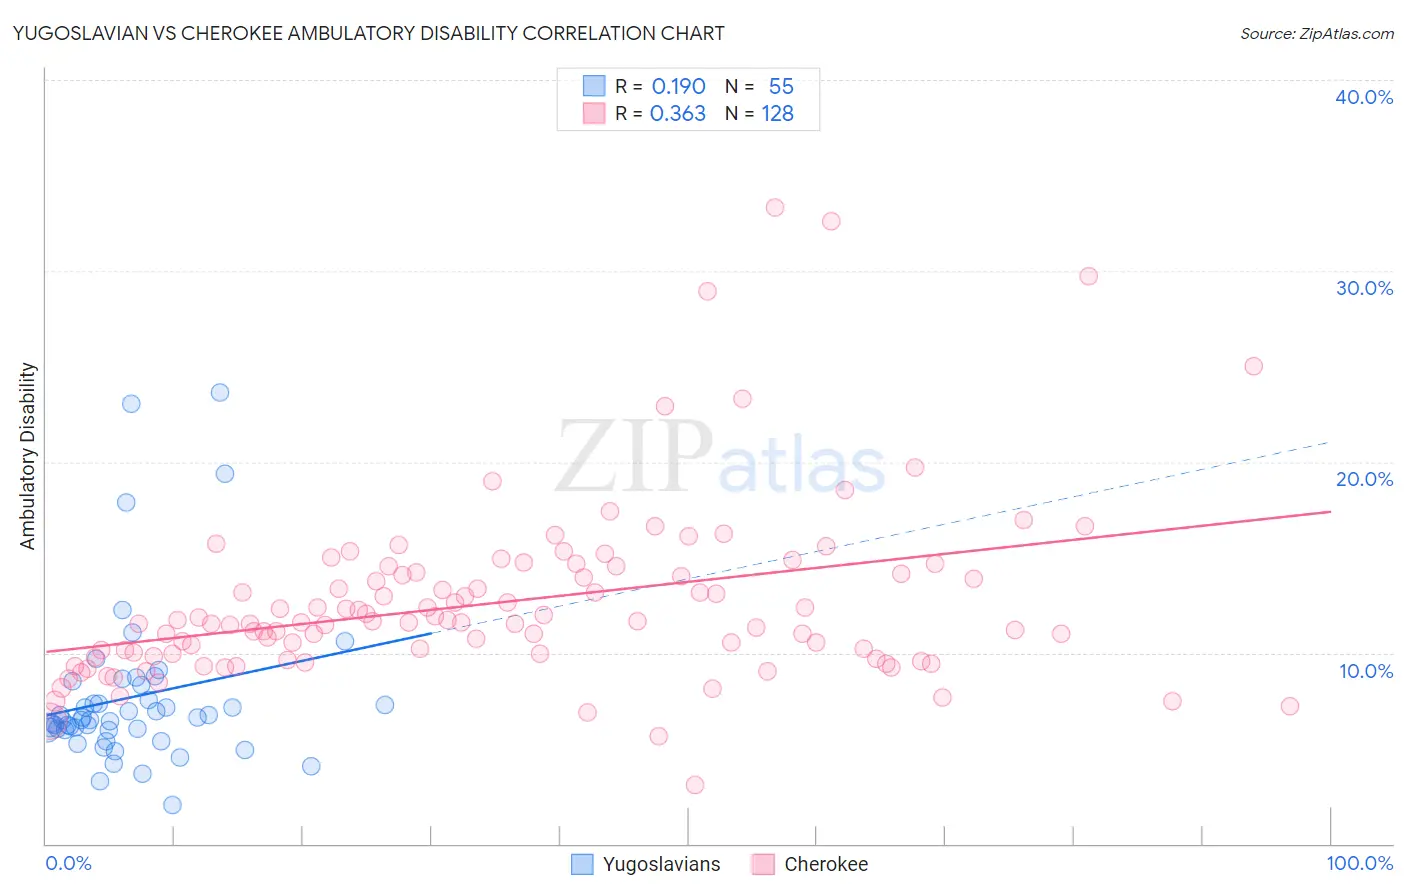
Yugoslavian vs Cherokee Ambulatory Disability Correlation Chart
The statistical analysis conducted on geographies consisting of 285,658,107 people shows a poor positive correlation between the proportion of Yugoslavians and percentage of population with ambulatory disability in the United States with a correlation coefficient (R) of 0.190 and weighted average of 6.3%. Similarly, the statistical analysis conducted on geographies consisting of 493,453,063 people shows a mild positive correlation between the proportion of Cherokee and percentage of population with ambulatory disability in the United States with a correlation coefficient (R) of 0.363 and weighted average of 7.9%, a difference of 25.2%.
Ambulatory Disability Correlation Summary
| Measurement | Yugoslavian | Cherokee |
| Minimum | 2.0% | 3.1% |
| Maximum | 23.6% | 33.3% |
| Range | 21.6% | 30.2% |
| Mean | 7.7% | 12.6% |
| Median | 6.5% | 11.6% |
| Interquartile 25% (IQ1) | 6.0% | 9.9% |
| Interquartile 75% (IQ3) | 8.3% | 14.2% |
| Interquartile Range (IQR) | 2.3% | 4.3% |
| Standard Deviation (Sample) | 4.2% | 4.7% |
| Standard Deviation (Population) | 4.2% | 4.7% |
Similar Demographics by Ambulatory Disability
Demographics Similar to Yugoslavians by Ambulatory Disability
In terms of ambulatory disability, the demographic groups most similar to Yugoslavians are Canadian (6.3%, a difference of 0.0%), Immigrants from Latin America (6.3%, a difference of 0.010%), Immigrants from Mexico (6.3%, a difference of 0.020%), Guamanian/Chamorro (6.3%, a difference of 0.040%), and Mexican American Indian (6.3%, a difference of 0.14%).
| Demographics | Rating | Rank | Ambulatory Disability |
| Immigrants | Laos | 13.2 /100 | #210 | Poor 6.3% |
| Samoans | 12.1 /100 | #211 | Poor 6.3% |
| Mexican American Indians | 12.0 /100 | #212 | Poor 6.3% |
| Japanese | 12.0 /100 | #213 | Poor 6.3% |
| Immigrants | Mexico | 11.0 /100 | #214 | Poor 6.3% |
| Immigrants | Latin America | 11.0 /100 | #215 | Poor 6.3% |
| Canadians | 10.9 /100 | #216 | Poor 6.3% |
| Yugoslavians | 10.9 /100 | #217 | Poor 6.3% |
| Guamanians/Chamorros | 10.6 /100 | #218 | Poor 6.3% |
| Indonesians | 9.9 /100 | #219 | Tragic 6.3% |
| Immigrants | Albania | 9.6 /100 | #220 | Tragic 6.3% |
| Hungarians | 9.6 /100 | #221 | Tragic 6.3% |
| German Russians | 9.4 /100 | #222 | Tragic 6.3% |
| Immigrants | Honduras | 7.6 /100 | #223 | Tragic 6.3% |
| Liberians | 7.1 /100 | #224 | Tragic 6.3% |
Demographics Similar to Cherokee by Ambulatory Disability
In terms of ambulatory disability, the demographic groups most similar to Cherokee are Menominee (7.8%, a difference of 0.89%), Yuman (7.9%, a difference of 0.94%), Cajun (7.8%, a difference of 1.2%), Chickasaw (8.0%, a difference of 2.1%), and Seminole (8.0%, a difference of 2.1%).
| Demographics | Rating | Rank | Ambulatory Disability |
| Blacks/African Americans | 0.0 /100 | #326 | Tragic 7.5% |
| Natives/Alaskans | 0.0 /100 | #327 | Tragic 7.5% |
| Hopi | 0.0 /100 | #328 | Tragic 7.6% |
| Pueblo | 0.0 /100 | #329 | Tragic 7.6% |
| Paiute | 0.0 /100 | #330 | Tragic 7.7% |
| Cajuns | 0.0 /100 | #331 | Tragic 7.8% |
| Menominee | 0.0 /100 | #332 | Tragic 7.8% |
| Cherokee | 0.0 /100 | #333 | Tragic 7.9% |
| Yuman | 0.0 /100 | #334 | Tragic 7.9% |
| Chickasaw | 0.0 /100 | #335 | Tragic 8.0% |
| Seminole | 0.0 /100 | #336 | Tragic 8.0% |
| Dutch West Indians | 0.0 /100 | #337 | Tragic 8.2% |
| Colville | 0.0 /100 | #338 | Tragic 8.2% |
| Pima | 0.0 /100 | #339 | Tragic 8.2% |
| Choctaw | 0.0 /100 | #340 | Tragic 8.3% |