Yaqui vs Immigrants from Japan Disability
COMPARE
Yaqui
Immigrants from Japan
Disability
Disability Comparison
Yaqui
Immigrants from Japan
13.1%
DISABILITY
0.0/ 100
METRIC RATING
291st/ 347
METRIC RANK
10.8%
DISABILITY
99.9/ 100
METRIC RATING
44th/ 347
METRIC RANK
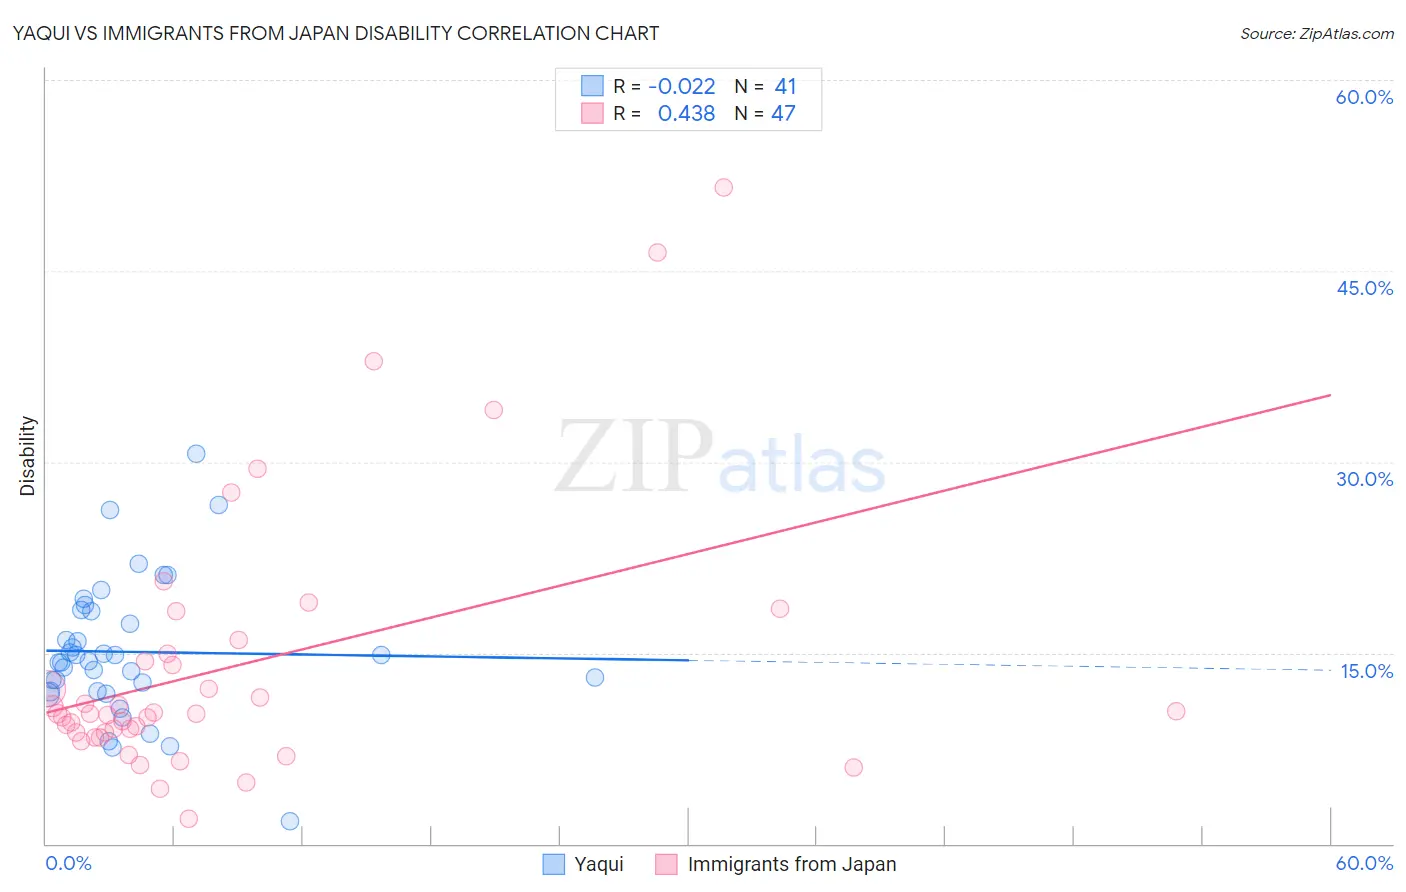
Yaqui vs Immigrants from Japan Disability Correlation Chart
The statistical analysis conducted on geographies consisting of 107,721,250 people shows no correlation between the proportion of Yaqui and percentage of population with a disability in the United States with a correlation coefficient (R) of -0.022 and weighted average of 13.1%. Similarly, the statistical analysis conducted on geographies consisting of 340,149,948 people shows a moderate positive correlation between the proportion of Immigrants from Japan and percentage of population with a disability in the United States with a correlation coefficient (R) of 0.438 and weighted average of 10.8%, a difference of 20.9%.
Disability Correlation Summary
| Measurement | Yaqui | Immigrants from Japan |
| Minimum | 1.8% | 2.0% |
| Maximum | 30.6% | 51.5% |
| Range | 28.9% | 49.5% |
| Mean | 15.1% | 13.9% |
| Median | 14.3% | 10.2% |
| Interquartile 25% (IQ1) | 12.0% | 8.7% |
| Interquartile 75% (IQ3) | 18.3% | 14.9% |
| Interquartile Range (IQR) | 6.3% | 6.2% |
| Standard Deviation (Sample) | 5.5% | 10.5% |
| Standard Deviation (Population) | 5.4% | 10.3% |
Similar Demographics by Disability
Demographics Similar to Yaqui by Disability
In terms of disability, the demographic groups most similar to Yaqui are Cheyenne (13.0%, a difference of 0.23%), Slovak (13.0%, a difference of 0.28%), White/Caucasian (13.0%, a difference of 0.29%), African (13.0%, a difference of 0.31%), and Aleut (13.1%, a difference of 0.36%).
| Demographics | Rating | Rank | Disability |
| Welsh | 0.0 /100 | #284 | Tragic 12.9% |
| Crow | 0.0 /100 | #285 | Tragic 12.9% |
| English | 0.0 /100 | #286 | Tragic 13.0% |
| Africans | 0.0 /100 | #287 | Tragic 13.0% |
| Whites/Caucasians | 0.0 /100 | #288 | Tragic 13.0% |
| Slovaks | 0.0 /100 | #289 | Tragic 13.0% |
| Cheyenne | 0.0 /100 | #290 | Tragic 13.0% |
| Yaqui | 0.0 /100 | #291 | Tragic 13.1% |
| Aleuts | 0.0 /100 | #292 | Tragic 13.1% |
| Marshallese | 0.0 /100 | #293 | Tragic 13.1% |
| Celtics | 0.0 /100 | #294 | Tragic 13.1% |
| Immigrants | Nonimmigrants | 0.0 /100 | #295 | Tragic 13.2% |
| Central American Indians | 0.0 /100 | #296 | Tragic 13.2% |
| Hopi | 0.0 /100 | #297 | Tragic 13.2% |
| Alaska Natives | 0.0 /100 | #298 | Tragic 13.2% |
Demographics Similar to Immigrants from Japan by Disability
In terms of disability, the demographic groups most similar to Immigrants from Japan are Israeli (10.8%, a difference of 0.10%), Immigrants from Nepal (10.8%, a difference of 0.15%), Immigrants from Australia (10.8%, a difference of 0.25%), Cambodian (10.8%, a difference of 0.29%), and Mongolian (10.8%, a difference of 0.29%).
| Demographics | Rating | Rank | Disability |
| Turks | 100.0 /100 | #37 | Exceptional 10.7% |
| Afghans | 99.9 /100 | #38 | Exceptional 10.8% |
| Cambodians | 99.9 /100 | #39 | Exceptional 10.8% |
| Mongolians | 99.9 /100 | #40 | Exceptional 10.8% |
| Immigrants | Australia | 99.9 /100 | #41 | Exceptional 10.8% |
| Immigrants | Nepal | 99.9 /100 | #42 | Exceptional 10.8% |
| Israelis | 99.9 /100 | #43 | Exceptional 10.8% |
| Immigrants | Japan | 99.9 /100 | #44 | Exceptional 10.8% |
| Immigrants | Peru | 99.9 /100 | #45 | Exceptional 10.8% |
| Tongans | 99.9 /100 | #46 | Exceptional 10.8% |
| Taiwanese | 99.9 /100 | #47 | Exceptional 10.8% |
| Soviet Union | 99.9 /100 | #48 | Exceptional 10.9% |
| Vietnamese | 99.9 /100 | #49 | Exceptional 10.9% |
| Immigrants | Saudi Arabia | 99.9 /100 | #50 | Exceptional 10.9% |
| Peruvians | 99.8 /100 | #51 | Exceptional 10.9% |