Yaqui vs Immigrants from Caribbean Disability
COMPARE
Yaqui
Immigrants from Caribbean
Disability
Disability Comparison
Yaqui
Immigrants from Caribbean
13.1%
DISABILITY
0.0/ 100
METRIC RATING
291st/ 347
METRIC RANK
12.0%
DISABILITY
9.1/ 100
METRIC RATING
208th/ 347
METRIC RANK
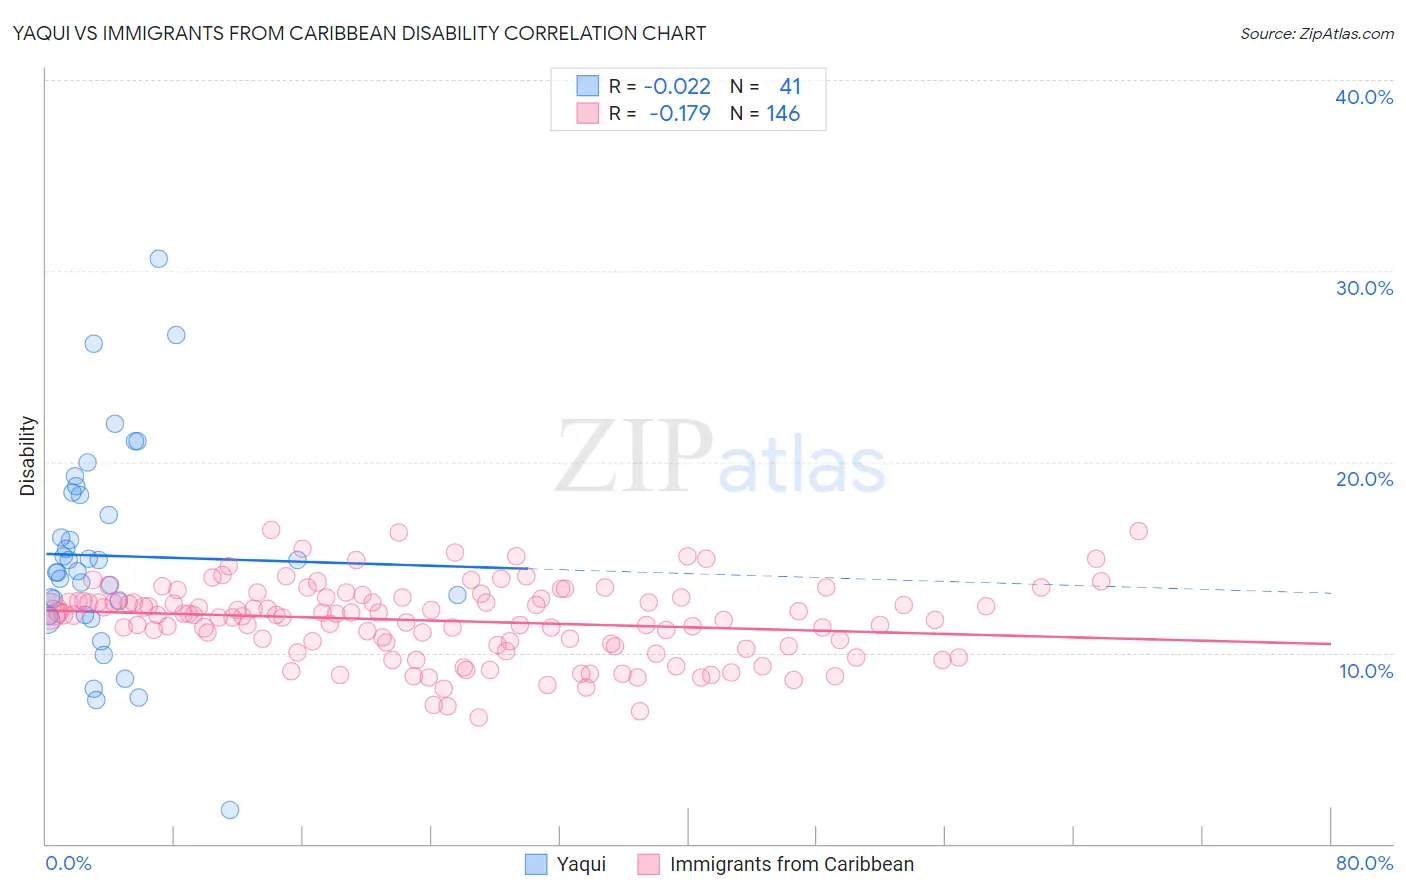
Yaqui vs Immigrants from Caribbean Disability Correlation Chart
The statistical analysis conducted on geographies consisting of 107,721,250 people shows no correlation between the proportion of Yaqui and percentage of population with a disability in the United States with a correlation coefficient (R) of -0.022 and weighted average of 13.1%. Similarly, the statistical analysis conducted on geographies consisting of 449,955,914 people shows a poor negative correlation between the proportion of Immigrants from Caribbean and percentage of population with a disability in the United States with a correlation coefficient (R) of -0.179 and weighted average of 12.0%, a difference of 8.8%.
Disability Correlation Summary
| Measurement | Yaqui | Immigrants from Caribbean |
| Minimum | 1.8% | 6.6% |
| Maximum | 30.6% | 16.5% |
| Range | 28.9% | 9.9% |
| Mean | 15.1% | 11.7% |
| Median | 14.3% | 12.0% |
| Interquartile 25% (IQ1) | 12.0% | 10.4% |
| Interquartile 75% (IQ3) | 18.3% | 12.8% |
| Interquartile Range (IQR) | 6.3% | 2.5% |
| Standard Deviation (Sample) | 5.5% | 2.0% |
| Standard Deviation (Population) | 5.4% | 2.0% |
Similar Demographics by Disability
Demographics Similar to Yaqui by Disability
In terms of disability, the demographic groups most similar to Yaqui are Cheyenne (13.0%, a difference of 0.23%), Slovak (13.0%, a difference of 0.28%), White/Caucasian (13.0%, a difference of 0.29%), African (13.0%, a difference of 0.31%), and Aleut (13.1%, a difference of 0.36%).
| Demographics | Rating | Rank | Disability |
| Welsh | 0.0 /100 | #284 | Tragic 12.9% |
| Crow | 0.0 /100 | #285 | Tragic 12.9% |
| English | 0.0 /100 | #286 | Tragic 13.0% |
| Africans | 0.0 /100 | #287 | Tragic 13.0% |
| Whites/Caucasians | 0.0 /100 | #288 | Tragic 13.0% |
| Slovaks | 0.0 /100 | #289 | Tragic 13.0% |
| Cheyenne | 0.0 /100 | #290 | Tragic 13.0% |
| Yaqui | 0.0 /100 | #291 | Tragic 13.1% |
| Aleuts | 0.0 /100 | #292 | Tragic 13.1% |
| Marshallese | 0.0 /100 | #293 | Tragic 13.1% |
| Celtics | 0.0 /100 | #294 | Tragic 13.1% |
| Immigrants | Nonimmigrants | 0.0 /100 | #295 | Tragic 13.2% |
| Central American Indians | 0.0 /100 | #296 | Tragic 13.2% |
| Hopi | 0.0 /100 | #297 | Tragic 13.2% |
| Alaska Natives | 0.0 /100 | #298 | Tragic 13.2% |
Demographics Similar to Immigrants from Caribbean by Disability
In terms of disability, the demographic groups most similar to Immigrants from Caribbean are Immigrants from Thailand (12.0%, a difference of 0.020%), Immigrants from Senegal (12.0%, a difference of 0.040%), Danish (12.0%, a difference of 0.050%), Immigrants from Western Europe (12.0%, a difference of 0.12%), and Czech (12.0%, a difference of 0.17%).
| Demographics | Rating | Rank | Disability |
| Assyrians/Chaldeans/Syriacs | 12.6 /100 | #201 | Poor 11.9% |
| Immigrants | England | 12.0 /100 | #202 | Poor 12.0% |
| British West Indians | 11.5 /100 | #203 | Poor 12.0% |
| Mexican American Indians | 11.4 /100 | #204 | Poor 12.0% |
| Immigrants | Western Europe | 10.1 /100 | #205 | Poor 12.0% |
| Immigrants | Senegal | 9.4 /100 | #206 | Tragic 12.0% |
| Immigrants | Thailand | 9.3 /100 | #207 | Tragic 12.0% |
| Immigrants | Caribbean | 9.1 /100 | #208 | Tragic 12.0% |
| Danes | 8.7 /100 | #209 | Tragic 12.0% |
| Czechs | 7.9 /100 | #210 | Tragic 12.0% |
| Immigrants | Cambodia | 7.3 /100 | #211 | Tragic 12.0% |
| Austrians | 7.2 /100 | #212 | Tragic 12.0% |
| Immigrants | Iraq | 7.1 /100 | #213 | Tragic 12.0% |
| Immigrants | Somalia | 6.8 /100 | #214 | Tragic 12.0% |
| Immigrants | Canada | 6.1 /100 | #215 | Tragic 12.1% |