Yaqui vs Bangladeshi Disability
COMPARE
Yaqui
Bangladeshi
Disability
Disability Comparison
Yaqui
Bangladeshis
13.1%
DISABILITY
0.0/ 100
METRIC RATING
291st/ 347
METRIC RANK
12.6%
DISABILITY
0.1/ 100
METRIC RATING
268th/ 347
METRIC RANK
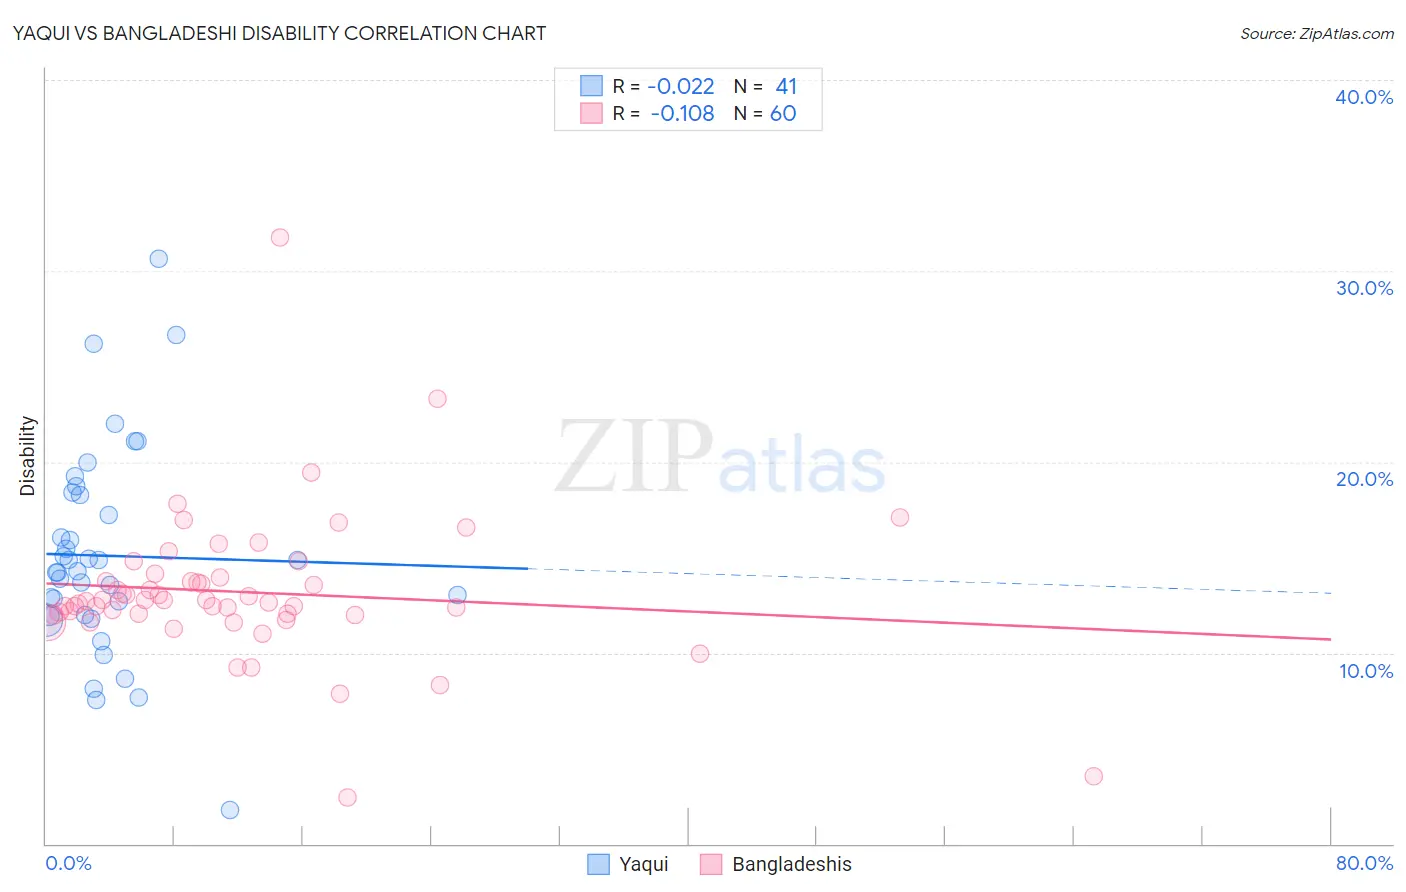
Yaqui vs Bangladeshi Disability Correlation Chart
The statistical analysis conducted on geographies consisting of 107,721,250 people shows no correlation between the proportion of Yaqui and percentage of population with a disability in the United States with a correlation coefficient (R) of -0.022 and weighted average of 13.1%. Similarly, the statistical analysis conducted on geographies consisting of 141,399,990 people shows a poor negative correlation between the proportion of Bangladeshis and percentage of population with a disability in the United States with a correlation coefficient (R) of -0.108 and weighted average of 12.6%, a difference of 3.9%.
Disability Correlation Summary
| Measurement | Yaqui | Bangladeshi |
| Minimum | 1.8% | 2.4% |
| Maximum | 30.6% | 31.8% |
| Range | 28.9% | 29.3% |
| Mean | 15.1% | 13.2% |
| Median | 14.3% | 12.7% |
| Interquartile 25% (IQ1) | 12.0% | 12.0% |
| Interquartile 75% (IQ3) | 18.3% | 13.8% |
| Interquartile Range (IQR) | 6.3% | 1.8% |
| Standard Deviation (Sample) | 5.5% | 4.0% |
| Standard Deviation (Population) | 5.4% | 3.9% |
Similar Demographics by Disability
Demographics Similar to Yaqui by Disability
In terms of disability, the demographic groups most similar to Yaqui are Cheyenne (13.0%, a difference of 0.23%), Slovak (13.0%, a difference of 0.28%), White/Caucasian (13.0%, a difference of 0.29%), African (13.0%, a difference of 0.31%), and Aleut (13.1%, a difference of 0.36%).
| Demographics | Rating | Rank | Disability |
| Welsh | 0.0 /100 | #284 | Tragic 12.9% |
| Crow | 0.0 /100 | #285 | Tragic 12.9% |
| English | 0.0 /100 | #286 | Tragic 13.0% |
| Africans | 0.0 /100 | #287 | Tragic 13.0% |
| Whites/Caucasians | 0.0 /100 | #288 | Tragic 13.0% |
| Slovaks | 0.0 /100 | #289 | Tragic 13.0% |
| Cheyenne | 0.0 /100 | #290 | Tragic 13.0% |
| Yaqui | 0.0 /100 | #291 | Tragic 13.1% |
| Aleuts | 0.0 /100 | #292 | Tragic 13.1% |
| Marshallese | 0.0 /100 | #293 | Tragic 13.1% |
| Celtics | 0.0 /100 | #294 | Tragic 13.1% |
| Immigrants | Nonimmigrants | 0.0 /100 | #295 | Tragic 13.2% |
| Central American Indians | 0.0 /100 | #296 | Tragic 13.2% |
| Hopi | 0.0 /100 | #297 | Tragic 13.2% |
| Alaska Natives | 0.0 /100 | #298 | Tragic 13.2% |
Demographics Similar to Bangladeshis by Disability
In terms of disability, the demographic groups most similar to Bangladeshis are Immigrants from Dominican Republic (12.6%, a difference of 0.090%), Spaniard (12.5%, a difference of 0.33%), Czechoslovakian (12.5%, a difference of 0.40%), Portuguese (12.6%, a difference of 0.48%), and Immigrants from Yemen (12.6%, a difference of 0.53%).
| Demographics | Rating | Rank | Disability |
| Scandinavians | 0.4 /100 | #261 | Tragic 12.4% |
| Native Hawaiians | 0.3 /100 | #262 | Tragic 12.5% |
| Hawaiians | 0.2 /100 | #263 | Tragic 12.5% |
| Immigrants | Germany | 0.2 /100 | #264 | Tragic 12.5% |
| U.S. Virgin Islanders | 0.2 /100 | #265 | Tragic 12.5% |
| Czechoslovakians | 0.2 /100 | #266 | Tragic 12.5% |
| Spaniards | 0.2 /100 | #267 | Tragic 12.5% |
| Bangladeshis | 0.1 /100 | #268 | Tragic 12.6% |
| Immigrants | Dominican Republic | 0.1 /100 | #269 | Tragic 12.6% |
| Portuguese | 0.1 /100 | #270 | Tragic 12.6% |
| Immigrants | Yemen | 0.1 /100 | #271 | Tragic 12.6% |
| Dominicans | 0.0 /100 | #272 | Tragic 12.7% |
| Finns | 0.0 /100 | #273 | Tragic 12.7% |
| Nepalese | 0.0 /100 | #274 | Tragic 12.8% |
| Sioux | 0.0 /100 | #275 | Tragic 12.8% |